
Page 160 - Neural Network Modeling and Identification of Dynamical Systems
P. 160
150 4. NEURAL NETWORK BLACK BOX MODELING OF AIRCRAFT CONTROLLED MOTION
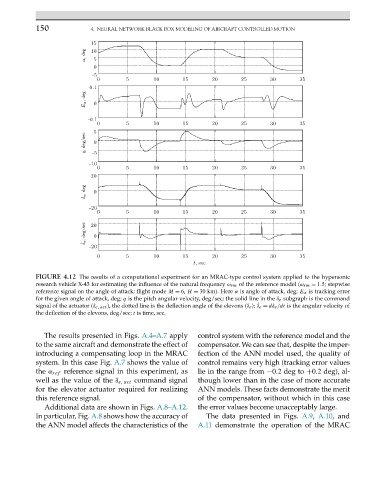
FIGURE 4.12 The results of a computational experiment for an MRAC-type control system applied to the hypersonic
research vehicle X-43 for estimating the influence of the natural frequency ω rm of the reference model (ω rm = 1.5;stepwise
reference signal on the angle of attack; flight mode M = 6, H = 30 km). Here α is angle of attack, deg; E α is tracking error
for the given angle of attack, deg; q is the pitch angular velocity, deg/sec; the solid line in the δ e subgraph is the command
signal of the actuator (δ e, act ), the dotted line is the deflection angle of the elevons (δ e ); ˙ δ e = dδ e /dt is the angular velocity of
the deflection of the elevons, deg/sec; t is time, sec.
The results presented in Figs. A.4–A.7 apply control system with the reference model and the
to the same aircraft and demonstrate the effect of compensator. We can see that, despite the imper-
introducing a compensating loop in the MRAC fection of the ANN model used, the quality of
system. In this case Fig. A.7 shows the value of control remains very high (tracking error values
the α ref reference signal in this experiment, as lie in the range from −0.2 deg to +0.2 deg), al-
well as the value of the δ e, act command signal though lower than in the case of more accurate
for the elevator actuator required for realizing ANN models. These facts demonstrate the merit
this reference signal. of the compensator, without which in this case
Additional data are shown in Figs. A.8–A.12. the error values become unacceptably large.
In particular, Fig. A.8 shows how the accuracy of The data presented in Figs. A.9, A.10,and
the ANN model affects the characteristics of the A.11 demonstrate the operation of the MRAC