
Page 227 - Numerical Analysis Using MATLAB and Excel
P. 227
Chapter 6 Fourier, Taylor, and Maclaurin Series
T
A
T/2
fb() π 2π
ωt
0
T/2
fa()
−A
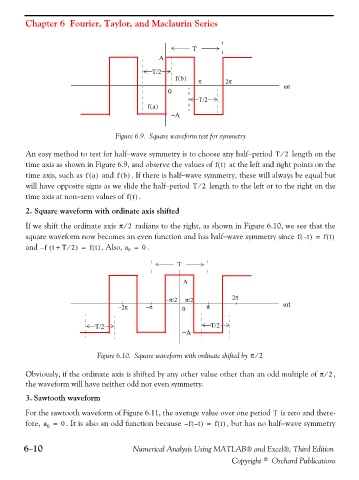
Figure 6.9. Square waveform test for symmetry
⁄
An easy method to test for half−wave symmetry is to choose any half−period T2 length on the
time axis as shown in Figure 6.9, and observe the values of ft() at the left and right points on the
time axis, such as fa() and fb() . If there is half−wave symmetry, these will always be equal but
will have opposite signs as we slide the half−period T2⁄ length to the left or to the right on the
time axis at non−zero values of ft() .
2. Square waveform with ordinate axis shifted
If we shift the ordinate axis π 2⁄ radians to the right, as shown in Figure 6.10, we see that the
t
square waveform now becomes an even function and has half−wave symmetry since f –() = ft()
and ft +( – T 2 = ft() . Also, a = . 0
)
⁄
0
T
A
−π/2 π/2 2π
−2π −π 0 π ωt
T/2 T/2
−A
⁄
Figure 6.10. Square waveform with ordinate shifted by π 2
Obviously, if the ordinate axis is shifted by any other value other than an odd multiple of π 2⁄ ,
the waveform will have neither odd nor even symmetry.
3. Sawtooth waveform
For the sawtooth waveform of Figure 6.11, the average value over one period is zero and there-
T
fore, a = 0 . It is also an odd function because f –()– t = ft() , but has no half−wave symmetry
0
6−10 Numerical Analysis Using MATLAB® and Excel®, Third Edition
Copyright © Orchard Publications