
Page 90 - Numerical Analysis Using MATLAB and Excel
P. 90
Characteristics of Sinusoids
that the frequency is 1 Hz or one cycle per second.
The frequency is denoted by the letter and in terms of the period and (3.1) we have
T
f
f = 1 or ω = 2πf (3.2)
---
T
The frequency is often referred to as the cyclic frequency to distinguish it from the radian fre-
f
ω
quency .
Since the cosine and sine functions are usually known in terms of degrees or radians, it is conve-
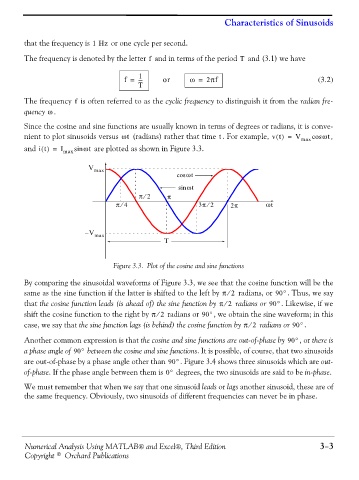
nient to plot sinusoids versus ωt (radians) rather that time . For example, v t() = V max cos ωt ,
t
and it() = I max sin ωt are plotted as shown in Figure 3.3.
V max 1
cos ωt
sin ωt
0.5
⁄
π 2 π
⁄
⁄
π 4 3π 2 2π ωt
0
-0.5
– V
max -1 0 1 2 3 4 5 6 7
T
Figure 3.3. Plot of the cosine and sine functions
By comparing the sinusoidal waveforms of Figure 3.3, we see that the cosine function will be the
⁄
same as the sine function if the latter is shifted to the left by π 2 radians, or 90° . Thus, we say
that the cosine function leads (is ahead of) the sine function by π 2⁄ radians or 90° . Likewise, if we
shift the cosine function to the right by π 2⁄ radians or 90° , we obtain the sine waveform; in this
case, we say that the sine function lags (is behind) the cosine function by π 2⁄ radians or 90° .
Another common expression is that the cosine and sine functions are out-of-phase by 90° , or there is
a phase angle of 90° between the cosine and sine functions. It is possible, of course, that two sinusoids
are out-of-phase by a phase angle other than 90° . Figure 3.4 shows three sinusoids which are out-
of-phase. If the phase angle between them is 0° degrees, the two sinusoids are said to be in-phase.
We must remember that when we say that one sinusoid leads or lags another sinusoid, these are of
the same frequency. Obviously, two sinusoids of different frequencies can never be in phase.
Numerical Analysis Using MATLAB® and Excel®, Third Edition 3−3
Copyright © Orchard Publications