
Page 288 - Numerical Analysis and Modelling in Geomechanics
P. 288
ENRICO PRIOLO 269
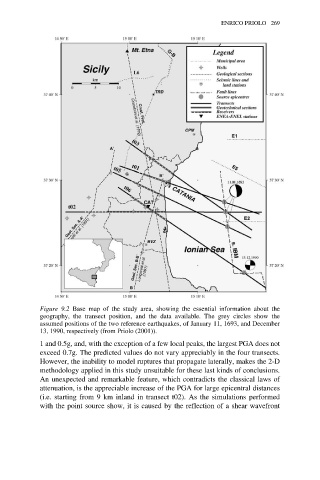
Figure 9.2 Base map of the study area, showing the essential information about the
geography, the transect position, and the data available. The grey circles show the
assumed positions of the two reference earthquakes, of January 11, 1693, and December
13, 1990, respectively (from Priolo (2001)).
1 and 0.5g, and, with the exception of a few local peaks, the largest PGA does not
exceed 0.7g. The predicted values do not vary appreciably in the four transects.
However, the inability to model ruptures that propagate laterally, makes the 2-D
methodology applied in this study unsuitable for these last kinds of conclusions.
An unexpected and remarkable feature, which contradicts the classical laws of
attenuation, is the appreciable increase of the PGA for large epicentral distances
(i.e. starting from 9 km inland in transect t02). As the simulations performed
with the point source show, it is caused by the reflection of a shear wavefront