
Page 290 - Numerical Analysis and Modelling in Geomechanics
P. 290
ENRICO PRIOLO 271
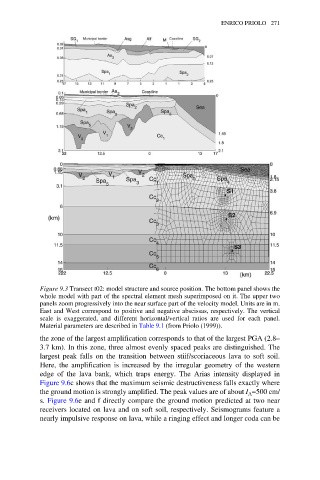
Figure 9.3 Transect t02: model structure and source position. The bottom panel shows the
whole model with part of the spectral element mesh superimposed on it. The upper two
panels zoom progressively into the near surface part of the velocity model. Units are in m.
East and West correspond to positive and negative abscissas, respectively. The vertical
scale is exaggerated, and different horizontal/vertical ratios are used for each panel.
Material parameters are described in Table 9.1 (from Priolo (1999)).
the zone of the largest amplification corresponds to that of the largest PGA (2.8–
3.7 km). In this zone, three almost evenly spaced peaks are distinguished. The
largest peak falls on the transition between stiif/scoriaceous lava to soft soil.
Here, the amplification is increased by the irregular geometry of the western
edge of the lava bank, which traps energy. The Arias intensity displayed in
Figure 9.6c shows that the maximum seismic destructiveness falls exactly where
the ground motion is strongly amplified. The peak values are of about I =500 cm/
A
s. Figure 9.6e and f directly compare the ground motion predicted at two near
receivers located on lava and on soft soil, respectively. Seismograms feature a
nearly impulsive response on lava, while a ringing effect and longer coda can be