
Page 295 - Numerical Analysis and Modelling in Geomechanics
P. 295
276 THE 2-D CHEBYSHEV SPECTRAL ELEMENT METHOD
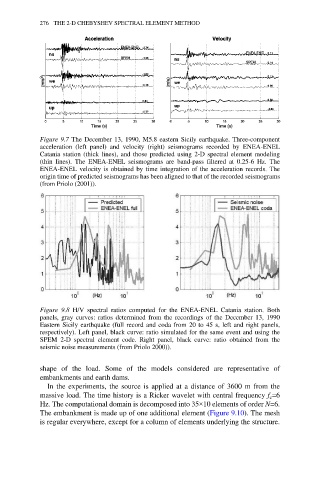
Figure 9.7 The December 13, 1990, M5.8 eastern Sicily earthquake. Three-component
acceleration (left panel) and velocity (right) seismograms recorded by ENEA-ENEL
Catania station (thick lines), and those predicted using 2-D spectral element modeling
(thin lines). The ENEA-ENEL seismograms are band-pass filtered at 0.25-6 Hz. The
ENEA-ENEL velocity is obtained by time integration of the acceleration records. The
origin time of predicted seismograms has been aligned to that of the recorded seismograms
(from Priolo (2001)).
Figure 9.8 H/V spectral ratios computed for the ENEA-ENEL Catania station. Both
panels, gray curves: ratios determined from the recordings of the December 13, 1990
Eastern Sicily earthquake (full record and coda from 20 to 45 s, left and right panels,
respectively). Left panel, black curve: ratio simulated for the same event and using the
SPEM 2-D spectral element code. Right panel, black curve: ratio obtained from the
seismic noise measurements (from Priolo 2000)).
shape of the load. Some of the models considered are representative of
embankments and earth dams.
In the experiments, the source is applied at a distance of 3600 m from the
massive load. The time history is a Ricker wavelet with central frequency f =6
c
Hz. The computational domain is decomposed into 35×10 elements of order N=6.
The embankment is made up of one additional element (Figure 9.10). The mesh
is regular everywhere, except for a column of elements underlying the structure.