
Page 292 - Numerical Analysis and Modelling in Geomechanics
P. 292
ENRICO PRIOLO 273
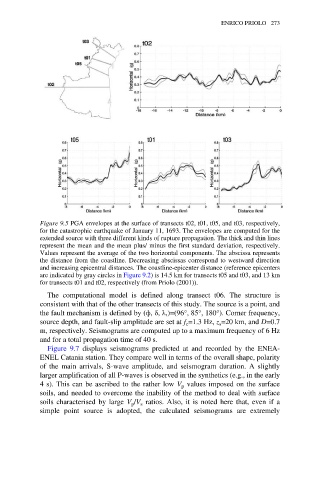
Figure 9.5 PGA envelopes at the surface of transects t02, t01, t05, and t03, respectively,
for the catastrophic earthquake of January 11, 1693. The envelopes are computed for the
extended source with three different kinds of rupture propagation. The thick and thin lines
represent the mean and the mean plus/ minus the first standard deviation, respectively.
Values represent the average of the two horizontal components. The abscissa represents
the distance from the coastline. Decreasing abscissas correspond to westward direction
and increasing epicentral distances. The coastline-epicenter distance (reference epicenters
are indicated by gray circles in Figure 9.2) is 14.5 km for transects t05 and t03, and 13 km
for transects t01 and t02, respectively (from Priolo (2001)).
The computational model is defined along transect t06. The structure is
consistent with that of the other transects of this study. The source is a point, and
the fault mechanism is defined by (ф, δ, λ,)=(96°, 85°, 180°). Corner frequency,
source depth, and fault-slip amplitude are set at f =1.3 Hz, z =20 km, and D=0.7
c
s
m, respectively. Seismograms are computed up to a maximum frequency of 6 Hz
and for a total propagation time of 40 s.
Figure 9.7 displays seismograms predicted at and recorded by the ENEA-
ENEL Catania station. They compare well in terms of the overall shape, polarity
of the main arrivals, S-wave amplitude, and seismogram duration. A slightly
larger amplification of all P-waves is observed in the synthetics (e.g., in the early
4 s). This can be ascribed to the rather low V p values imposed on the surface
soils, and needed to overcome the inability of the method to deal with surface
soils characterised by large V /V s ratios. Also, it is noted here that, even if a
p
simple point source is adopted, the calculated seismograms are extremely