
Page 289 - Numerical Analysis and Modelling in Geomechanics
P. 289
270 THE 2-D CHEBYSHEV SPECTRAL ELEMENT METHOD
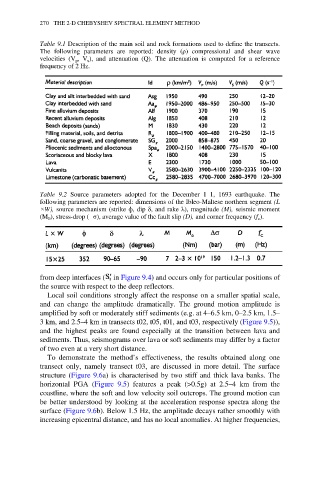
Table 9.1 Description of the main soil and rock formations used to define the transects.
The following parameters are reported: density (ρ) compressional and shear wave
velocities (V p , V s ), and attenuation (Q). The attenuation is computed for a reference
frequency of 2 Hz.
Table 9.2 Source parameters adopted for the December 1 1, 1693 earthquake. The
following parameters are reported: dimensions of the Ibleo-Maltese northern segment (L
×W), source mechanism (strike ф, dip δ, and rake λ), magnitude (M), seismic moment
(M 0 ), stress-drop (≥ σ), average value of the fault slip (D), and corner frequency (f c ).
from deep interfaces ( in Figure 9.4) and occurs only for particular positions of
the source with respect to the deep reflectors.
Local soil conditions strongly affect the response on a smaller spatial scale,
and can change the amplitude dramatically. The ground motion amplitude is
amplified by soft or moderately stiff sediments (e.g. at 4–6.5 km, 0–2.5 km, 1.5–
3 km, and 2.5–4 km in transects t02, t05, t01, and t03, respectively (Figure 9.5)),
and the highest peaks are found especially at the transition between lava and
sediments. Thus, seismograms over lava or soft sediments may differ by a factor
of two even at a very short distance.
To demonstrate the method’s effectiveness, the results obtained along one
transect only, namely transect t03, are discussed in more detail. The surface
structure (Figure 9.6a) is characterised by two stiff and thick lava banks. The
horizontal PGA (Figure 9.5) features a peak (>0.5g) at 2.5–4 km from the
coastline, where the soft and low velocity soil outcrops. The ground motion can
be better understood by looking at the acceleration response spectra along the
surface (Figure 9.6b). Below 1.5 Hz, the amplitude decays rather smoothly with
increasing epicentral distance, and has no local anomalies. At higher frequencies,