
Page 291 - Numerical Analysis and Modelling in Geomechanics
P. 291
272 THE 2-D CHEBYSHEV SPECTRAL ELEMENT METHOD
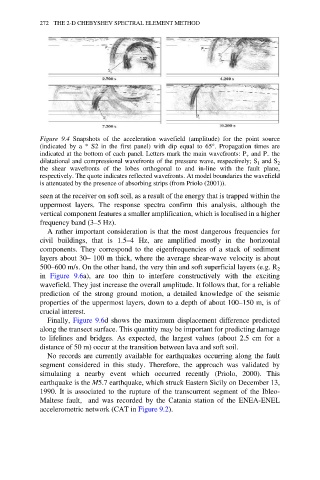
Figure 9.4 Snapshots of the acceleration wavefield (amplitude) for the point source
(indicated by a * S2 in the first panel) with dip equal to 65°. Propagation times are
indicated at the bottom of each panel. Letters mark the main wavefronts: P + and P − the
dilatational and compressional wavefronts of the pressure wave, respectively; S 1 and S 2
the shear wavefronts of the lobes orthogonal to and in-line with the fault plane,
respectively. The quote indicates reflected wavefronts. At model boundaries the wavefield
is attenuated by the presence of absorbing strips (from Priolo (2001)).
seen at the receiver on soft soil, as a result of the energy that is trapped within the
uppermost layers. The response spectra confirm this analysis, although the
vertical component features a smaller amplification, which is localised in a higher
frequency band (3–5 Hz).
A rather important consideration is that the most dangerous frequencies for
civil buildings, that is 1.5–4 Hz, are amplified mostly in the horizontal
components. They correspond to the eigenfrequencies of a stack of sediment
layers about 30– 100 m thick, where the average shear-wave velocity is about
500–600 m/s. On the other hand, the very thin and soft superficial layers (e.g. R 2
in Figure 9.6a), are too thin to interfere constructively with the exciting
wavefield. They just increase the overall amplitude. It follows that, for a reliable
prediction of the strong ground motion, a detailed knowledge of the seismic
properties of the uppermost layers, down to a depth of about 100–150 m, is of
crucial interest.
Finally, Figure 9.6d shows the maximum displacement difference predicted
along the transect surface. This quantity may be important for predicting damage
to lifelines and bridges. As expected, the largest values (about 2.5 cm for a
distance of 50 m) occur at the transition between lava and soft soil.
No records are currently available for earthquakes occurring along the fault
segment considered in this study. Therefore, the approach was validated by
simulating a nearby event which occurred recently (Priolo, 2000). This
earthquake is the M5.7 earthquake, which struck Eastern Sicily on December 13,
1990. It is associated to the rupture of the transcurrent segment of the Ibleo-
Maltese fault, and was recorded by the Catania station of the ENEA-ENEL
accelerometric network (CAT in Figure 9.2).