
Page 315 - Numerical Analysis and Modelling in Geomechanics
P. 315
296 ANALYSIS AND DESIGN OF PILE GROUPS
Benchmark solutions in the linear and non-linear range are presented, and the
significant influence of soil non-linearity on load distribution between individual
piles in a group is highlighted.
Single pile response
In comparing non-linear solutions for single pile response to axial loading, the
problem examined is that reported by Poulos (1989) in his Rankine Lecture. This
example offers the opportunity to assess the validity of the non-linear hyperbolic
model adopted by PGROUPN by comparison with well-established numerical
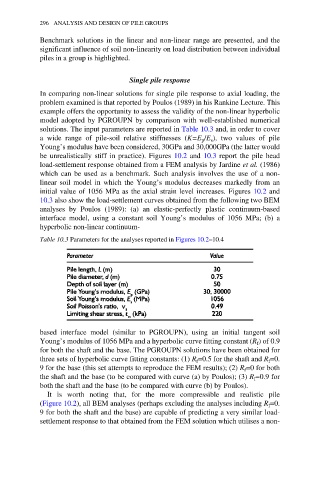
solutions. The input parameters are reported in Table 10.3 and, in order to cover
a wide range of pile-soil relative stiffnesses (K=E /E ), two values of pile
p
s
Young’s modulus have been considered, 30GPa and 30,000GPa (the latter would
be unrealistically stiff in practice). Figures 10.2 and 10.3 report the pile head
load-settlement response obtained from a FEM analysis by Jardine et al. (1986)
which can be used as a benchmark. Such analysis involves the use of a non-
linear soil model in which the Young’s modulus decreases markedly from an
initial value of 1056 MPa as the axial strain level increases. Figures 10.2 and
10.3 also show the load-settlement curves obtained from the following two BEM
analyses by Poulos (1989): (a) an elastic-perfectly plastic continuum-based
interface model, using a constant soil Young’s modulus of 1056 MPa; (b) a
hyperbolic non-linear continuum-
Table 10.3 Parameters for the analyses reported in Figures 10.2–10.4
based interface model (similar to PGROUPN), using an initial tangent soil
Young’s modulus of 1056 MPa and a hyperbolic curve fitting constant (R ) of 0.9
f
for both the shaft and the base. The PGROUPN solutions have been obtained for
three sets of hyperbolic curve fitting constants: (1) R =0.5 for the shaft and R =0.
f
f
9 for the base (this set attempts to reproduce the FEM results); (2) R =0 for both
f
the shaft and the base (to be compared with curve (a) by Poulos); (3) R =0.9 for
f
both the shaft and the base (to be compared with curve (b) by Poulos).
It is worth noting that, for the more compressible and realistic pile
(Figure 10.2), all BEM analyses (perhaps excluding the analyses including R =0.
f
9 for both the shaft and the base) are capable of predicting a very similar load-
settlement response to that obtained from the FEM solution which utilises a non-