
Page 316 - Numerical Analysis and Modelling in Geomechanics
P. 316
F.BASILE 297
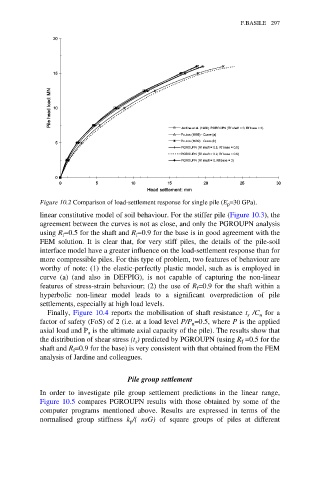
Figure 10.2 Comparison of load-settlement response for single pile (E p =30 GPa).
linear constitutive model of soil behaviour. For the stiffer pile (Figure 10.3), the
agreement between the curves is not as close, and only the PGROUPN analysis
using R =0.5 for the shaft and R =0.9 for the base is in good agreement with the
f
f
FEM solution. It is clear that, for very stiff piles, the details of the pile-soil
interface model have a greater influence on the load-settlement response than for
more compressible piles. For this type of problem, two features of behaviour are
worthy of note: (1) the elastic-perfectly plastic model, such as is employed in
curve (a) (and also in DEFPIG), is not capable of capturing the non-linear
features of stress-strain behaviour; (2) the use of R =0.9 for the shaft within a
f
hyperbolic non-linear model leads to a significant overprediction of pile
settlements, especially at high load levels.
Finally, Figure 10.4 reports the mobilisation of shaft resistance t s /C u for a
factor of safety (FoS) of 2 (i.e. at a load level P/P =0.5, where P is the applied
u
axial load and P is the ultimate axial capacity of the pile). The results show that
u
the distribution of shear stress (t ) predicted by PGROUPN (using R =0.5 for the
s
f
shaft and R =0.9 for the base) is very consistent with that obtained from the FEM
f
analysis of Jardine and colleagues.
Pile group settlement
In order to investigate pile group settlement predictions in the linear range,
Figure 10.5 compares PGROUPN results with those obtained by some of the
computer programs mentioned above. Results are expressed in terms of the
normalised group stiffness k /(′ nsG) of square groups of piles at different
p