
Page 318 - Numerical Analysis and Modelling in Geomechanics
P. 318
F.BASILE 299
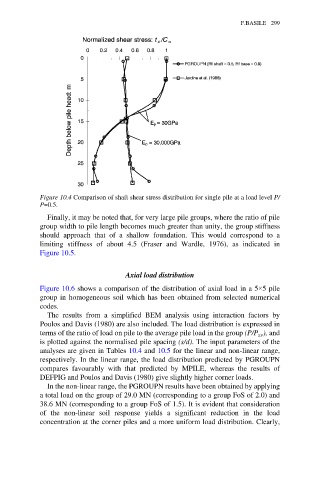
Figure 10.4 Comparison of shaft shear stress distribution for single pile at a load level P/
P=0.5.
Finally, it may be noted that, for very large pile groups, where the ratio of pile
group width to pile length becomes much greater than unity, the group stiffness
should approach that of a shallow foundation. This would correspond to a
limiting stiffness of about 4.5 (Fraser and Wardle, 1976), as indicated in
Figure 10.5.
Axial load distribution
Figure 10.6 shows a comparison of the distribution of axial load in a 5×5 pile
group in homogeneous soil which has been obtained from selected numerical
codes.
The results from a simplified BEM analysis using interaction factors by
Poulos and Davis (1980) are also included. The load distribution is expressed in
terms of the ratio of load on pile to the average pile load in the group (P/P ), and
av
is plotted against the normalised pile spacing (s/d). The input parameters of the
analyses are given in Tables 10.4 and 10.5 for the linear and non-linear range,
respectively. In the linear range, the load distribution predicted by PGROUPN
compares favourably with that predicted by MPILE, whereas the results of
DEFPIG and Poulos and Davis (1980) give slightly higher corner loads.
In the non-linear range, the PGROUPN results have been obtained by applying
a total load on the group of 29.0 MN (corresponding to a group FoS of 2.0) and
38.6 MN (corresponding to a group FoS of 1.5). It is evident that consideration
of the non-linear soil response yields a significant reduction in the load
concentration at the corner piles and a more uniform load distribution. Clearly,