
Page 63 - Numerical Analysis and Modelling in Geomechanics
P. 63
44 A.A.JAVADI
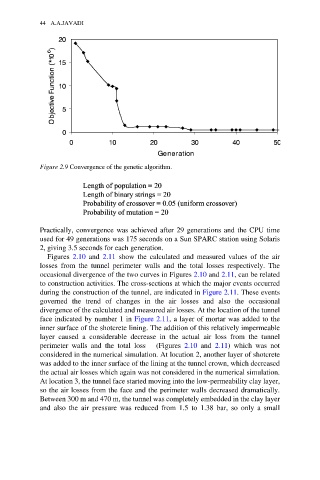
Figure 2.9 Convergence of the genetic algorithm.
Practically, convergence was achieved after 29 generations and the CPU time
used for 49 generations was 175 seconds on a Sun SPARC station using Solaris
2, giving 3.5 seconds for each generation.
Figures 2.10 and 2.11 show the calculated and measured values of the air
losses from the tunnel perimeter walls and the total losses respectively. The
occasional divergence of the two curves in Figures 2.10 and 2.11, can be related
to construction activities. The cross-sections at which the major events occurred
during the construction of the tunnel, are indicated in Figure 2.11. These events
governed the trend of changes in the air losses and also the occasional
divergence of the calculated and measured air losses. At the location of the tunnel
face indicated by number 1 in Figure 2.11, a layer of mortar was added to the
inner surface of the shotcrete lining. The addition of this relatively impermeable
layer caused a considerable decrease in the actual air loss from the tunnel
perimeter walls and the total loss (Figures 2.10 and 2.11) which was not
considered in the numerical simulation. At location 2, another layer of shotcrete
was added to the inner surface of the lining at the tunnel crown, which decreased
the actual air losses which again was not considered in the numerical simulation.
At location 3, the tunnel face started moving into the low-permeability clay layer,
so the air losses from the face and the perimeter walls decreased dramatically.
Between 300 m and 470 m, the tunnel was completely embedded in the clay layer
and also the air pressure was reduced from 1.5 to 1.38 bar, so only a small