
Page 416 - Offshore Electrical Engineering Manual
P. 416
Example 8.1.2 403
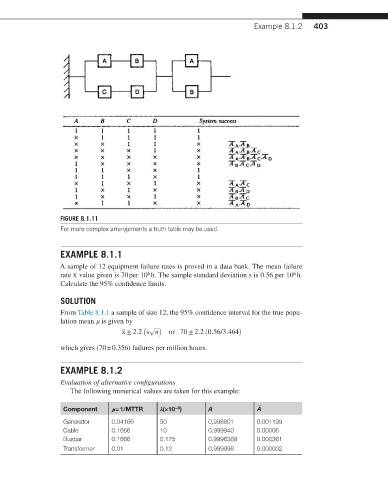
FIGURE 8.1.11
For more complex arrangements a truth table may be used.
EXAMPLE 8.1.1
A sample of 12 equipment failure rates is proved in a data bank. The mean failure
6
6
rate x value given is 70 per 10 h. The sample standard deviation s is 0.56 per 10 h.
Calculate the 95% confidence limits.
SOLUTION
From Table 8.1.1 a sample of size 12, the 95% confidence interval for the true popu-
lation mean μ is given by
( √ )
x ± 2.2 s n or 70 ± 2.2 (0.56/3.464)
which gives (70 ± 0.356) failures per million hours.
EXAMPLE 8.1.2
Evaluation of alternative configurations
The following numerical values are taken for this example:
Component μ = 1/MTTR λ(×10 ) A A
−6
Generator 0.04166 50 0.998801 0.001199
Cable 0.1666 10 0.999940 0.00006
Busbar 0.1666 0.175 0.9996389 0.000361
Transformer 0.01 0.13 0.999998 0.000002