
Page 417 - Offshore Electrical Engineering Manual
P. 417
404 CHAPTER 1 Reliability
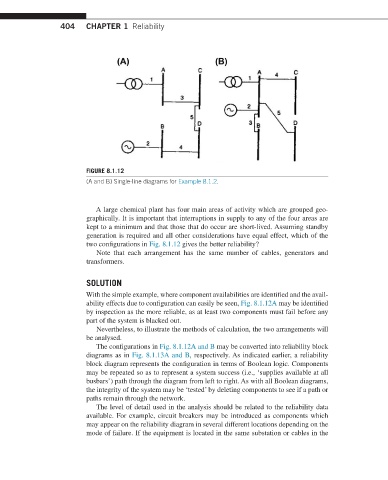
FIGURE 8.1.12
(A and B) Single-line diagrams for Example 8.1.2.
A large chemical plant has four main areas of activity which are grouped geo-
graphically. It is important that interruptions in supply to any of the four areas are
kept to a minimum and that those that do occur are short-lived. Assuming standby
generation is required and all other considerations have equal effect, which of the
two configurations in Fig. 8.1.12 gives the better reliability?
Note that each arrangement has the same number of cables, generators and
transformers.
SOLUTION
With the simple example, where component availabilities are identified and the avail-
ability effects due to configuration can easily be seen, Fig. 8.1.12A may be identified
by inspection as the more reliable, as at least two components must fail before any
part of the system is blacked out.
Nevertheless, to illustrate the methods of calculation, the two arrangements will
be analysed.
The configurations in Fig. 8.1.12A and B may be converted into reliability block
diagrams as in Fig. 8.1.13A and B, respectively. As indicated earlier, a reliability
block diagram represents the configuration in terms of Boolean logic. Components
may be repeated so as to represent a system success (i.e., ‘supplies available at all
busbars’) path through the diagram from left to right. As with all Boolean diagrams,
the integrity of the system may be ‘tested’ by deleting components to see if a path or
paths remain through the network.
The level of detail used in the analysis should be related to the reliability data
available. For example, circuit breakers may be introduced as components which
may appear on the reliability diagram in several different locations depending on the
mode of failure. If the equipment is located in the same substation or cables in the