
Page 418 - Offshore Electrical Engineering Manual
P. 418
Example 8.1.2 405
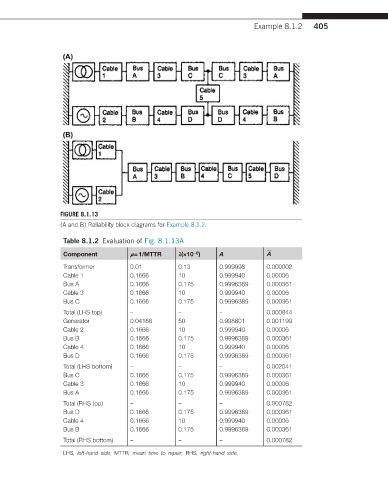
FIGURE 8.1.13
(A and B) Reliability block diagrams for Example 8.1.2.
Table 8.1.2 Evaluation of Fig. 8.1.13A
−6
Component μ = 1/MTTR λ(×10 ) A A
Transformer 0.01 0.13 0.999998 0.000002
Cable 1 0.1666 10 0.999940 0.00006
Bus A 0.1666 0.175 0.9996389 0.000361
Cable 3 0.1666 10 0.999940 0.00006
Bus C 0.1666 0.175 0.9996389 0.000361
Total (LHS top) – – – 0.000844
Generator 0.04166 50 0.998801 0.001199
Cable 2 0.1666 10 0.999940 0.00006
Bus B 0.1666 0.175 0.9996389 0.000361
Cable 4 0.1666 10 0.999940 0.00006
Bus D 0.1666 0.175 0.9996389 0.000361
Total (LHS bottom) – – – 0.002041
Bus C 0.1666 0.175 0.9996389 0.000361
Cable 3 0.1666 10 0.999940 0.00006
Bus A 0.1666 0.175 0.9996389 0.000361
Total (RHS top) – – – 0.000782
Bus D 0.1666 0.175 0.9996389 0.000361
Cable 4 0.1666 10 0.999940 0.00006
Bus B 0.1666 0.175 0.9996389 0.000361
Total (RHS bottom) – – – 0.000782
LHS, left-hand side; MTTR, mean time to repair; RHS, right-hand side.