
Page 419 - Offshore Electrical Engineering Manual
P. 419
406 CHAPTER 1 Reliability
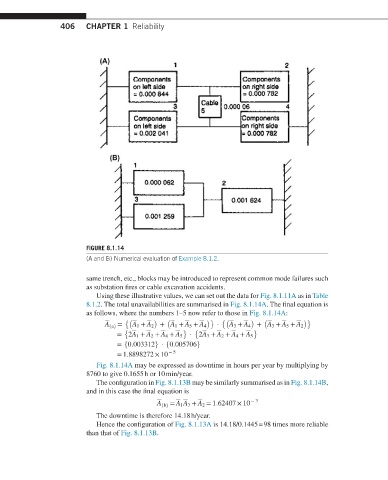
FIGURE 8.1.14
(A and B) Numerical evaluation of Example 8.1.2.
same trench, etc., blocks may be introduced to represent common mode failures such
as substation fires or cable excavation accidents.
Using these illustrative values, we can set out the data for Fig. 8.1.11A as in Table
8.1.2. The total unavailabilities are summarised in Fig. 8.1.14A. The final equation is
as follows, where the numbers 1–5 now refer to those in Fig. 8.1.14A:
{( ) ( )} {( ) ( )}
A (a) = A 1 + A 2 + A 1 + A 5 + A 4 · A 3 + A 4 + A 3 + A 5 + A 2
{ } { }
= 2A 1 + A 2 + A 4 + A 5 · 2A 3 + A 2 + A 4 + A 5
= {0.003312}· {0.005706}
= 1.8898272 × 10 − 5
Fig. 8.1.14A may be expressed as downtime in hours per year by multiplying by
8760 to give 0.1655 h or 10 min/year.
The configuration in Fig. 8.1.13B may be similarly summarised as in Fig. 8.1.14B,
and in this case the final equation is
A (b) = A 1 A 3 + A 2 = 1.62407 × 10 − 3
The downtime is therefore 14.18 h/year.
Hence the configuration of Fig. 8.1.13A is 14.18/0.1445 = 98 times more reliable
than that of Fig. 8.1.13B.