
Page 246 - Op Amps Design, Applications, and Troubleshooting
P. 246
228 ACTIVE FILTERS
TABLE 5.2
Design Goal Measured Value
Cutoff frequency 300 hertz 352.8 hertz
Input impedance >2000 ohms >10 kilohms
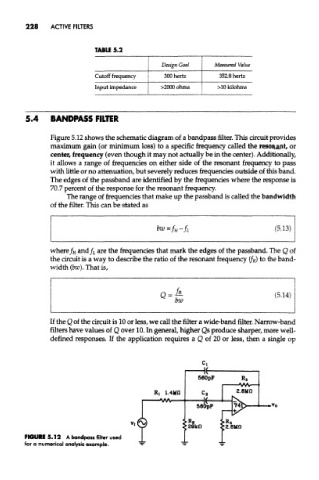
5.4 BANDPASS FILTER
Figure 5.12 shows the schematic diagram of a bandpass filter. This circuit provides
maximum gain (or iriinimum loss) to a specific frequency called the resonant, or
center, frequency (even though it may not actually be in the center). Additionally,
it allows a range of frequencies on either side of the resonant frequency to pass
with little or no attenuation, but severely reduces frequencies outside of this band.
The edges of the passband are identified by the frequencies where the response is
70.7 percent of the response for the resonant frequency.
The range of frequencies that make up the passband is called the bandwidth
of the filter. This can be stated as
where/H and/ L are the frequencies that mark the edges of the passband. The Q of
the circuit is a way to describe the ratio of the resonant frequency (f R) to the band-
width (bw). That is,
If the Q of the circuit is 10 or less, we call the filter a wide-band filter. Narrow-band
filters have values of Q over 10. In general, higher Qs produce sharper, more well-
defined responses. If the application requires a Q of 20 or less, then a single op
FIGURE 5.12 A bandpass fitter used
for a numerical analysis example.