
Page 198 - Optical Communications Essentials
P. 198
Optical Amplifiers
188 Chapter Eleven
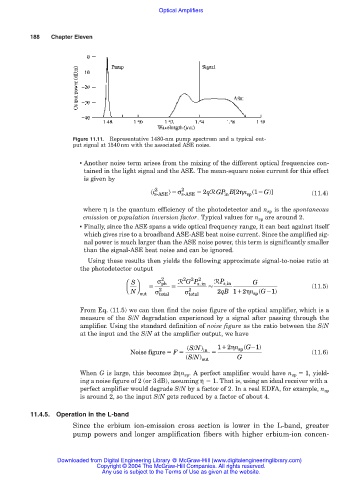
Figure 11.11. Representative 1480-nm pump spectrum and a typical out-
put signal at 1540nm with the associated ASE noise.
■ Another noise term arises from the mixing of the different optical frequencies con-
tained in the light signal and the ASE. The mean-square noise current for this effect
is given by
2
i sASE σ 2 sASE 2 q GP B [2η n (1 G)] (11.4)
R
-
-
in
sp
where η is the quantum efficiency of the photodetector and n sp is the spontaneous
emission or population inversion factor. Typical values for n sp are around 2.
■ Finally, since the ASE spans a wide optical frequency range, it can beat against itself
which gives rise to a broadband ASE-ASE beat noise current. Since the amplified sig-
nal power is much larger than the ASE noise power, this term is significantly smaller
than the signal-ASE beat noise and can be ignored.
Using these results then yields the following approximate signal-to-noise ratio at
the photodetector output
2
2
2
S σ 2 ph R GP s, in RP s, in G
N 2 2 (11.5)
ηn (G
out σ total σ total 2qB 1 2 n sp 1)
From Eq. (11.5) we can then find the noise figure of the optical amplifier, which is a
measure of the S/N degradation experienced by a signal after passing through the
amplifier. Using the standard definition of noise figure as the ratio between the S/N
at the input and the S/N at the amplifier output, we have
(S/N ) in 12 nη sp (G 1)
Noise figure F (11.6)
(S/N ) out G
When G is large, this becomes 2ηn sp . A perfect amplifier would have n sp 1, yield-
ing a noise figure of 2 (or 3dB), assuming η 1. That is, using an ideal receiver with a
perfect amplifier would degrade S/N by a factor of 2. In a real EDFA, for example, n sp
is around 2, so the input S/N gets reduced by a factor of about 4.
11.4.5. Operation in the L-band
Since the erbium ion-emission cross section is lower in the L-band, greater
pump powers and longer amplification fibers with higher erbium-ion concen-
Downloaded from Digital Engineering Library @ McGraw-Hill (www.digitalengineeringlibrary.com)
Copyright © 2004 The McGraw-Hill Companies. All rights reserved.
Any use is subject to the Terms of Use as given at the website.