
Page 193 - Optical Communications Essentials
P. 193
Optical Amplifiers
Optical Amplifiers 183
some of its energy and drop to the desired lasing level. From this level a signal
photon can then trigger the excited electron into stimulated emission, whereby
the electron releases its remaining energy in the form of a new photon with an
identical wavelength as the signal photon. Since the pump photon must have a
higher energy than the signal photon, the pump wavelength is shorter than the
signal wavelength.
Erbium Energy Bands To get a phenomenological understanding of how an EDFA
works, we need to look at the energy-level structure of erbium. The erbium atoms in
silica are actually Er 3+ ions, which are erbium atoms that have lost three of their
outer electrons. In describing the transitions of the outer electrons in these ions to
higher energy states, it is common to refer to the process as “raising the ions to higher
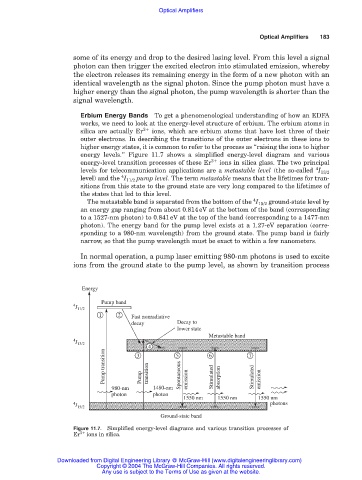
energy levels.” Figure 11.7 shows a simplified energy-level diagram and various
energy-level transition processes of these Er 3+ ions in silica glass. The two principal
4
levels for telecommunication applications are a metastable level (the so-called I 13/2
4
level) and the I 11/2 pump level. The term metastable means that the lifetimes for tran-
sitions from this state to the ground state are very long compared to the lifetimes of
the states that led to this level.
4
The metastable band is separated from the bottom of the I 15/2 ground-state level by
an energy gap ranging from about 0.814eV at the bottom of the band (corresponding
to a 1527-nm photon) to 0.841eV at the top of the band (corresponding to a 1477-nm
photon). The energy band for the pump level exists at a 1.27-eV separation (corre-
sponding to a 980-nm wavelength) from the ground state. The pump band is fairly
narrow, so that the pump wavelength must be exact to within a few nanometers.
In normal operation, a pump laser emitting 980-nm photons is used to excite
ions from the ground state to the pump level, as shown by transition process
Energy
Pump band
4
I 11/2
1 2 Fast nonradiative
decay Decay to
lower state
Metastable band
4
I 13/2
4 5 6 7
Pump transition transition Spontaneous Stimulated Stimulated
3
980-nm Pump 1480-nm emission absorption emission
photon photon
1550 nm 1550 nm 1550 nm
4 photons
I 15/2
Ground-state band
Figure 11.7. Simplified energy-level diagrams and various transition processes of
Er 3 ions in silica.
Downloaded from Digital Engineering Library @ McGraw-Hill (www.digitalengineeringlibrary.com)
Copyright © 2004 The McGraw-Hill Companies. All rights reserved.
Any use is subject to the Terms of Use as given at the website.