
Page 191 - Optical Communications Essentials
P. 191
Optical Amplifiers
Optical Amplifiers 181
30
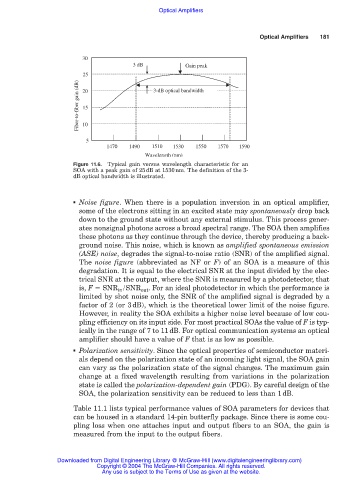
3 dB Gain peak
25
Fiber-to-fiber gain (dB) 20 3-dB optical bandwidth
15
10
5
1470 1490 1510 1530 1550 1570 1590
Wavelength (nm)
Figure 11.6. Typical gain versus wavelength characteristic for an
SOA with a peak gain of 25dB at 1530nm. The definition of the 3-
dB optical bandwidth is illustrated.
■ Noise figure. When there is a population inversion in an optical amplifier,
some of the electrons sitting in an excited state may spontaneously drop back
down to the ground state without any external stimulus. This process gener-
ates nonsignal photons across a broad spectral range. The SOA then amplifies
these photons as they continue through the device, thereby producing a back-
ground noise. This noise, which is known as amplified spontaneous emission
(ASE) noise, degrades the signal-to-noise ratio (SNR) of the amplified signal.
The noise figure (abbreviated as NF or F) of an SOA is a measure of this
degradation. It is equal to the electrical SNR at the input divided by the elec-
trical SNR at the output, where the SNR is measured by a photodetector, that
is, F SNR in /SNR out . For an ideal photodetector in which the performance is
limited by shot noise only, the SNR of the amplified signal is degraded by a
factor of 2 (or 3dB), which is the theoretical lower limit of the noise figure.
However, in reality the SOA exhibits a higher noise level because of low cou-
pling efficiency on its input side. For most practical SOAs the value of F is typ-
ically in the range of 7 to 11dB. For optical communication systems an optical
amplifier should have a value of F that is as low as possible.
■ Polarization sensitivity. Since the optical properties of semiconductor materi-
als depend on the polarization state of an incoming light signal, the SOA gain
can vary as the polarization state of the signal changes. The maximum gain
change at a fixed wavelength resulting from variations in the polarization
state is called the polarization-dependent gain (PDG). By careful design of the
SOA, the polarization sensitivity can be reduced to less than 1dB.
Table 11.1 lists typical performance values of SOA parameters for devices that
can be housed in a standard 14-pin butterfly package. Since there is some cou-
pling loss when one attaches input and output fibers to an SOA, the gain is
measured from the input to the output fibers.
Downloaded from Digital Engineering Library @ McGraw-Hill (www.digitalengineeringlibrary.com)
Copyright © 2004 The McGraw-Hill Companies. All rights reserved.
Any use is subject to the Terms of Use as given at the website.