
Page 291 - Optofluidics Fundamentals, Devices, and Applications
P. 291
Optofluidic Micr oscope 265
50 μm
(a)
50 μm
(b)
50 μm
(c)
50 μm
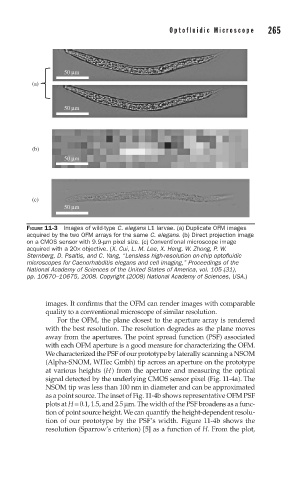
FIGURE 11-3 Images of wild-type C. elegans L1 larvae. (a) Duplicate OFM images
acquired by the two OFM arrays for the same C. elegans. (b) Direct projection image
on a CMOS sensor with 9.9-μm pixel size. (c) Conventional microscope image
acquired with a 20× objective. (X. Cui, L. M. Lee, X. Heng, W. Zhong, P. W.
Sternberg, D. Psaltis, and C. Yang, “Lensless high-resolution on-chip optofl uidic
microscopes for Caenorhabditis elegans and cell imaging,” Proceedings of the
National Academy of Sciences of the United States of America, vol. 105 (31),
pp. 10670–10675, 2008. Copyright (2008) National Academy of Sciences, USA.)
images. It confirms that the OFM can render images with comparable
quality to a conventional microscope of similar resolution.
For the OFM, the plane closest to the aperture array is rendered
with the best resolution. The resolution degrades as the plane moves
away from the apertures. The point spread function (PSF) associated
with each OFM aperture is a good measure for characterizing the OFM.
We characterized the PSF of our prototype by laterally scanning a NSOM
(Alpha-SNOM, WITec Gmbh) tip across an aperture on the prototype
at various heights (H) from the aperture and measuring the optical
signal detected by the underlying CMOS sensor pixel (Fig. 11-4a). The
NSOM tip was less than 100 nm in diameter and can be approximated
as a point source. The inset of Fig. 11-4b shows representative OFM PSF
plots at H = 0.1, 1.5, and 2.5 μm. The width of the PSF broadens as a func-
tion of point source height. We can quantify the height-dependent resolu-
tion of our prototype by the PSF’s width. Figure 11-4b shows the
resolution (Sparrow’s criterion) [5] as a function of H. From the plot,