
Page 293 - Optofluidics Fundamentals, Devices, and Applications
P. 293
Optofluidic Micr oscope 267
Wild-type
(a)
50 μm
50 μm Sma-3
(b)
Dpy-7
(c)
50 μm
300 13
250 12
Length (μm) 200 Width (μm) 11
10
150
100
50 9 8
0 7
(d) (e)
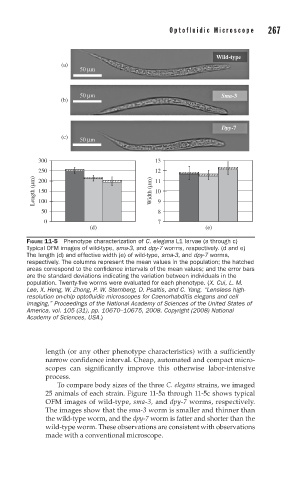
FIGURE 11-5 Phenotype characterization of C. elegans L1 larvae (a through c)
Typical OFM images of wild-type, sma-3, and dpy-7 worms, respectively. (d and e)
The length (d) and effective width (e) of wild-type, sma-3, and dpy-7 worms,
respectively. The columns represent the mean values in the population; the hatched
areas correspond to the confi dence intervals of the mean values; and the error bars
are the standard deviations indicating the variation between individuals in the
population. Twenty-fi ve worms were evaluated for each phenotype. (X. Cui, L. M.
Lee, X. Heng, W. Zhong, P. W. Sternberg, D. Psaltis, and C. Yang, “Lensless high-
resolution on-chip optofl uidic microscopes for Caenorhabditis elegans and cell
imaging,” Proceedings of the National Academy of Sciences of the United States of
America, vol. 105 (31), pp. 10670–10675, 2008. Copyright (2008) National
Academy of Sciences, USA.)
length (or any other phenotype characteristics) with a sufficiently
narrow confidence interval. Cheap, automated and compact micro-
scopes can significantly improve this otherwise labor-intensive
process.
To compare body sizes of the three C. elegans strains, we imaged
25 animals of each strain. Figure 11-5a through 11-5c shows typical
OFM images of wild-type, sma-3, and dpy-7 worms, respectively.
The images show that the sma-3 worm is smaller and thinner than
the wild-type worm, and the dpy-7 worm is fatter and shorter than the
wild-type worm. These observations are consistent with observations
made with a conventional microscope.