
Page 157 - Organic Electronics in Sensors and Biotechnology
P. 157
134 Cha pte r F o u r
100
Melinex 55:45
90
Teonex
80
Dielectric constant 70 200 Molten phase
60
50
40
30 150 T m
20
20 30 40 50 60 70 80 90 100 110 100 Paraelectric phase
Temperature (°C) T c
(a) Temperature (°C) 50
10
8 0 Anti-ferroelectric Ferroelectric phase
phase?
6
Saturation P. +
4 rem. P. + –50
D (μC/cm 2 ) –2 2 0 rem. P. – PTrFE 20 VDF content (mol %) 80 PVDF
Saturation P. –
100
40
0
60
–4 (c)
–6
–8
–10
20 30 40 50 60 70 80 90 100 110
Temperature (°C)
(b)
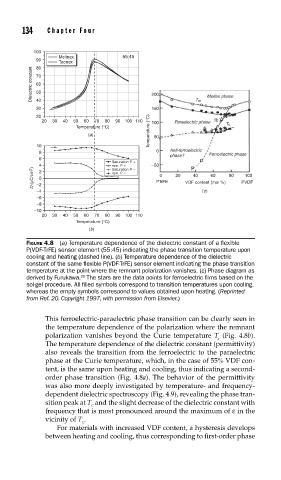
FIGURE 4.8 (a) Temperature dependence of the dielectric constant of a fl exible
P(VDF-TrFE) sensor element (55:45) indicating the phase transition temperature upon
cooling and heating (dashed line). (b) Temperature dependence of the dielectric
constant of the same fl exible P(VDF-TrFE) sensor element indicating the phase transition
temperature at the point where the remnant polarization vanishes. (c) Phase diagram as
derived by Furukawa. The stars are the data points for ferroelectric fi lms based on the
20
sol-gel procedure. All fi lled symbols correspond to transition temperatures upon cooling,
whereas the empty symbols correspond to values obtained upon heating. (Reprinted
from Ref. 20. Copyright 1997, with permission from Elsevier.)
This ferroelectric-paraelectric phase transition can be clearly seen in
the temperature dependence of the polarization where the remnant
polarization vanishes beyond the Curie temperature T (Fig. 4.8b).
c
The temperature dependence of the dielectric constant (permittivity)
also reveals the transition from the ferroelectric to the paraelectric
phase at the Curie temperature, which, in the case of 55% VDF con-
tent, is the same upon heating and cooling, thus indicating a second-
order phase transition (Fig. 4.8a). The behavior of the permittivity
was also more deeply investigated by temperature- and frequency-
dependent dielectric spectroscopy (Fig. 4.9), revealing the phase tran-
sition peak at T and the slight decrease of the dielectric constant with
C
frequency that is most pronounced around the maximum of ε in the
vicinity of T .
C
For materials with increased VDF content, a hysteresis develops
between heating and cooling, thus corresponding to first-order phase