
Page 158 - Organic Electronics in Sensors and Biotechnology
P. 158
Integrated Pyr oelectric Sensors 135
70
60
Dielectric constant 50
40
30
20
100 k
20 10 k
40
60 1 k
80 Frequency (Hz)
100 100
Temperature (°C)
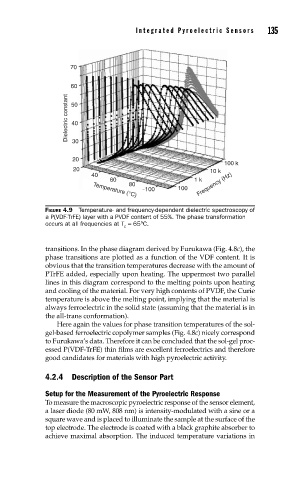
FIGURE 4.9 Temperature- and frequency-dependent dielectric spectroscopy of
a P(VDF-TrFE) layer with a PVDF content of 55%. The phase transformation
occurs at all frequencies at T = 65°C.
C
transitions. In the phase diagram derived by Furukawa (Fig. 4.8c), the
phase transitions are plotted as a function of the VDF content. It is
obvious that the transition temperatures decrease with the amount of
PTrFE added, especially upon heating. The uppermost two parallel
lines in this diagram correspond to the melting points upon heating
and cooling of the material. For very high contents of PVDF, the Curie
temperature is above the melting point, implying that the material is
always ferroelectric in the solid state (assuming that the material is in
the all-trans conformation).
Here again the values for phase transition temperatures of the sol-
gel-based ferroelectric copolymer samples (Fig. 4.8c) nicely correspond
to Furukawa’s data. Therefore it can be concluded that the sol-gel proc-
essed P(VDF-TrFE) thin films are excellent ferroelectrics and therefore
good candidates for materials with high pyroelectric activity.
4.2.4 Description of the Sensor Part
Setup for the Measurement of the Pyroelectric Response
To measure the macroscopic pyroelectric response of the sensor element,
a laser diode (80 mW, 808 nm) is intensity-modulated with a sine or a
square wave and is placed to illuminate the sample at the surface of the
top electrode. The electrode is coated with a black graphite absorber to
achieve maximal absorption. The induced temperature variations in