
Page 361 - Organic Electronics in Sensors and Biotechnology
P. 361
338 Chapter Nine
charged peptide with a random-coil conformation, JR2K, forced the
polyelectrolyte to adopt a nonplanar conformation with separated
polyelectrolyte chains, observed as a blue shift and an increased
intensity of the emitted light. In contrast, upon exposure to a nega-
tively charged peptide with a random-coil conformation, JR2E, the
backbone adopts a planar conformation, and aggregation of the poly-
electrolyte chains occurs, seen as a red shift and a decreased intensity
of the emitted light. Finally, by adding JR2K to the POWT-JR2E com-
plex, the intensity of the emitted light is increased and blue-shifted,
which is associated with separation of the polyelectrolyte chains. This
geometric alteration of the polyelectrolyte chains is due to the confor-
mational changes of the peptides upon formation of the four-helix-
bundle motif. Hence, different emission spectra of POWT could be
assigned to the charge distribution and/or the conformational state
of the synthetic peptides (Fig. 9.4b).
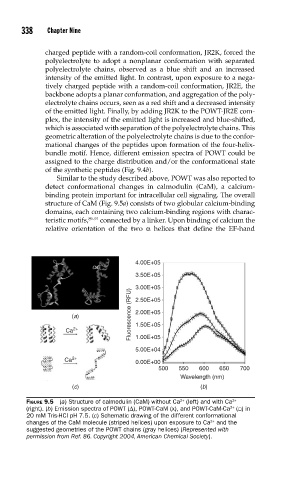
Similar to the study described above, POWT was also reported to
detect conformational changes in calmodulin (CaM), a calcium-
binding protein important for intracellular cell signaling. The overall
structure of CaM (Fig. 9.5a) consists of two globular calcium-binding
domains, each containing two calcium-binding regions with charac-
teristic motifs, 89–91 connected by a linker. Upon binding of calcium the
relative orientation of the two α helices that define the EF-hand
4.00E+05
3.50E+05
3.00E+05
Fluorescence (RFU) 2.00E+05
2.50E+05
(a)
Ca 2+ 1.50E+05
1.00E+05
5.00E+04
Ca 2+ 0.00E+00
500 550 600 650 700
Wavelength (nm)
(c) (b)
FIGURE 9.5 (a) Structure of calmodulin (CaM) without Ca (left) and with Ca 2+
2+
2+
(right). (b) Emission spectra of POWT (Δ), POWT-CaM (x), and POWT-CaM-Ca ( ) in
20 mM Tris-HCl pH 7.5. (c) Schematic drawing of the different conformational
2+
changes of the CaM molecule (striped helices) upon exposure to Ca and the
suggested geometries of the POWT chains (gray helices) (Represented with
permission from Ref. 86. Copyright 2004, American Chemical Society).