
Page 363 - Organic Electronics in Sensors and Biotechnology
P. 363
340 Chapter Nine
(a)
10 nm
Monomeric native insulin
13 Å
(d)
(c) Fibrillation
Partially unfolded
(b) Misfolding &
oligomerization
Unfolded
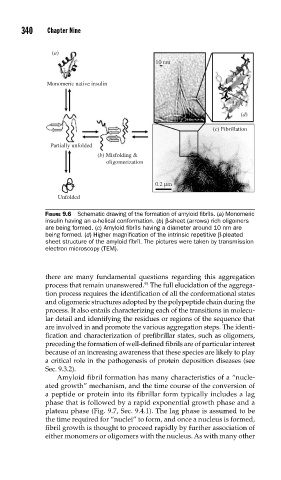
FIGURE 9.6 Schematic drawing of the formation of amyloid fi brils. (a) Monomeric
insulin having an α-helical conformation. (b) β-sheet (arrows) rich oligomers
are being formed. (c) Amyloid fi brils having a diameter around 10 nm are
being formed. (d) Higher magnifi cation of the intrinsic repetitive β-pleated
sheet structure of the amyloid fi bril. The pictures were taken by transmission
electron microscopy (TEM).
there are many fundamental questions regarding this aggregation
93
process that remain unanswered. The full elucidation of the aggrega-
tion process requires the identification of all the conformational states
and oligomeric structures adopted by the polypeptide chain during the
process. It also entails characterizing each of the transitions in molecu-
lar detail and identifying the residues or regions of the sequence that
are involved in and promote the various aggregation steps. The identi-
fication and characterization of prefibrillar states, such as oligomers,
preceding the formation of well-defined fibrils are of particular interest
because of an increasing awareness that these species are likely to play
a critical role in the pathogenesis of protein deposition diseases (see
Sec. 9.3.2).
Amyloid fibril formation has many characteristics of a “nucle-
ated growth” mechanism, and the time course of the conversion of
a peptide or protein into its fibrillar form typically includes a lag
phase that is followed by a rapid exponential growth phase and a
plateau phase (Fig. 9.7, Sec. 9.4.1). The lag phase is assumed to be
the time required for “nuclei” to form, and once a nucleus is formed,
fibril growth is thought to proceed rapidly by further association of
either monomers or oligomers with the nucleus. As with many other