Page 375 - Organic Electronics in Sensors and Biotechnology
P. 375

352    Chapter  Nine


                                       CWD             Sheep scrapie
                                           (a)
                         Separated LCP chains
                                  1.9

                                  1.7
                                 Ratio 532/639  1.5    CWD

                                  1.3
                                  1.1  Sheep scrapie
                                  0.9
                    Aggregated LCP chains  0.6  0.7  0.8  0.9  1.0
                                              Ratio 532/Emax  Nonplanar
                      Planar LCP backbone
                                                           LCP backbone
                                           (b)

                         150                              PTAA
                                                          Native PrP
                        Fluorescence (RFU)  100
                                                          PrP fibrils A
                                                          PrP fibrils B

                          50


                           0
                           500      550     600     650      700
                                        Wavelength (nm)
                                           (c)
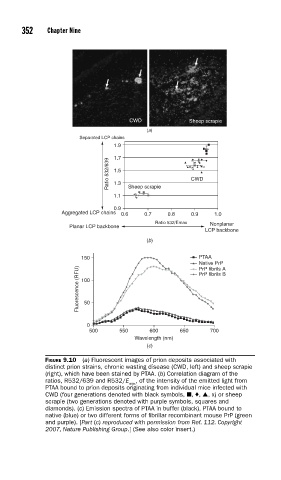
               FIGURE 9.10  (a) Fluorescent images of prion deposits associated with
               distinct prion strains, chronic wasting disease (CWD, left) and sheep scrapie
               (right), which have been stained by PTAA. (b) Correlation diagram of the
               ratios, R532/639 and R532/E  , of the intensity of the emitted light from
                                      max
               PTAA bound to prion deposits originating from individual mice infected with
               CWD (four generations denoted with black symbols, Q, x, V, x) or sheep
               scrapie (two generations denoted with purple symbols, squares and
               diamonds). (c) Emission spectra of PTAA in buffer (black), PTAA bound to
               native (blue) or two different forms of fi brillar recombinant mouse PrP (green
               and purple). [Part (c) reproduced with permission from Ref. 112. Copyright
               2007, Nature Publishing Group.] (See also color insert.)
   370   371   372   373   374   375   376   377   378   379   380