Page 459 - Organic Electronics in Sensors and Biotechnology
P. 459

Ag electrode
                                       PDMS
                                       Microchannel
                                       P3HT       Vds
                                       Solid
                                       electrolyte  Gnd
                                       Glass  Vg
                        5 V

                         ≥0 V

                       Oxidized
                       P3HT
                       Neutral
                       P3HT
                       a
                              b
                                       c


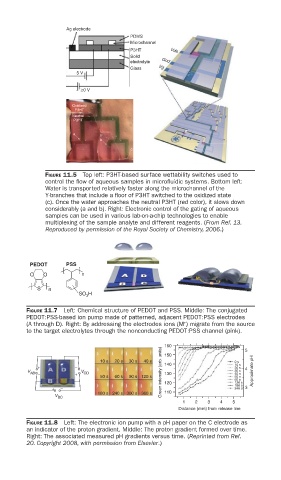
               FIGURE 11.5  Top left: P3HT-based surface wettability switches used to
               control the fl ow of aqueous samples in microfl uidic systems. Bottom left:
               Water is transported relatively faster along the microchannel of the
               Y-branches that include a fl oor of P3HT switched to the oxidized state
               (c). Once the water approaches the neutral P3HT (red color), it slows down
               considerably (a and b). Right: Electronic control of the gating of aqueous
               samples can be used in various lab-on-a-chip technologies to enable
               multiplexing of the sample analyte and different reagents. (From Ref. 13.
               Reproduced by permission of the Royal Society of Chemistry, 2006.)


           PEDOT     PSS
           O   O         n
             S  n
                           H
                         SO 3
          FIGURE 11.7  Left: Chemical structure of PEDOT and PSS. Middle: The conjugated
          PEDOT:PSS-based ion pump made of patterned, adjacent PEDOT:PSS electrodes
                                                     +
          (A through D). Right: By addressing the electrodes ions (M ) migrate from the source
          to the target electrolytes through the nonconducting PEDOT:PSS channel (pink).
                                                160                   5
                              10 s  20 s  30 s  40 s  150          0 s
             +          –                       140                10 s  4
                                                                   20 s
          V AB           V CD                  Green intensity (arb. units)  130  30 s  Approximate pH
                        +
             –
                              50 s  60 s  90 s  120 s              40 s
                                                                   50 s
                                                                   60 s
                                                                   180 s
                 +  –                           120                120 s  3
                                                                   240 s
                              180 s  240 s  300 s  360 s  110
                  V BC
                                                     1   2  3  4   5
                                                    Distance (mm) from release line
          FIGURE 11.8  Left: The electronic ion pump with a pH paper on the C electrode as
          an indicator of the proton gradient. Middle: The proton gradient formed over time.
          Right: The associated measured pH gradients versus time. (Reprinted from Ref.
          20. Copyright 2008, with permission from Elsevier.)
   454   455   456   457   458   459