
Page 458 - Organic Electronics in Sensors and Biotechnology
P. 458
500 nm 10 μm
60 nm
250 nm 5 μm
0 nm 0 μm
0 nm 250 nm 500 nm 0 μm 5 μm 10 μm
(a) (b)
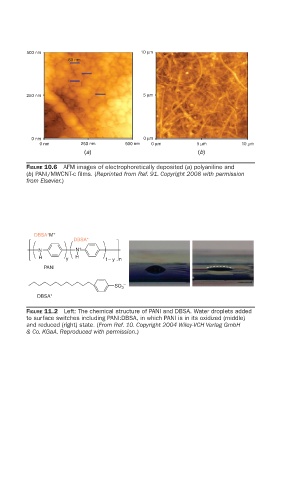
FIGURE 10.6 AFM images of electrophoretically deposited (a) polyaniline and
(b) PANI/MWCNT-c fi lms. (Reprinted from Ref. 91. Copyright 2008 with permission
from Elsevier.)
DBSA*M +
DBSA*
N N +
H y H 1– y n
PANI
–
SO 3
DBSA*
FIGURE 11.2 Left: The chemical structure of PANI and DBSA. Water droplets added
to surface switches including PANI:DBSA, in which PANI is in its oxidized (middle)
and reduced (right) state. (From Ref. 10. Copyright 2004 Wiley-VCH Verlag GmbH
& Co. KGaA. Reproduced with permission.)