
Page 455 - Organic Electronics in Sensors and Biotechnology
P. 455
700 1.2
Fluorescence (RFU) 600 Ratio 560/600 nm 1.0
500
400
300
0.8
200
100 0.6
0
480 530 580 630 680 0 2 4 6 8 10
Wavelength (nm) Time (h)
(a) (b)
20 μm
20 μm
(c) (d)
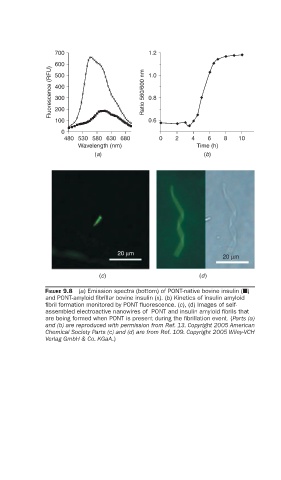
FIGURE 9.8 (a) Emission spectra (bottom) of PONT-native bovine insulin (Q)
and PONT-amyloid fi brillar bovine insulin (x). (b) Kinetics of insulin amyloid
fi bril formation monitored by PONT fl uorescence. (c), (d) Images of self-
assembled electroactive nanowires of PONT and insulin amyloid fi brils that
are being formed when PONT is present during the fi brillation event. (Parts (a)
and (b) are reproduced with permission from Ref. 13. Copyright 2005 American
Chemical Society Parts (c) and (d) are from Ref. 109. Copyright 2005 Wiley-VCH
Verlag GmbH & Co. KGaA.)