
Page 450 - Organic Electronics in Sensors and Biotechnology
P. 450
Voltage response Current response
1 MΩ
10 MΩ
10 0
100 MΩ
1 GΩ
10 –1 10 –7 10 GΩ
Voltage (V) 10 –2 Current (A)
100 GΩ
1 MΩ
10 –3
10 MΩ
100 MΩ
10 –4 1 GΩ
10 GΩ
100 GΩ 10 –8
10 –5
10 –4 10 –2 10 0 10 2 10 4 10 6 10 –4 10 –2 10 0 10 2 10 4 10 6
Frequency (Hz) Frequency (Hz)
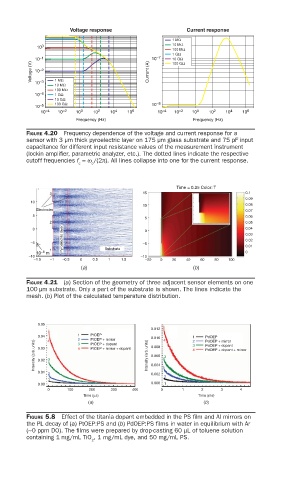
FIGURE 4.20 Frequency dependence of the voltage and current response for a
sensor with 3 μm thick pyroelectric layer on 175 μm glass substrate and 75 pF input
capacitance for different input resistance values of the measurement instrument
(lockin amplifi er, parametric analyzer, etc.). The dotted lines indicate the respective
cutoff frequencies f =ω /(2π). All lines collapse into one for the current response.
c c
Time = 0.25 Color: T
3 15 0.1
2 0.09
10
10 0.08
Electrodes 0.07
5 0.06
5 1
2 0.05
Pyroelectric layer 0.03
0 0 0.04
0.02
–5 –5 0.01
1 Substrate
–6
10 m 0
–10 –10
–1.5 –1 –0.5 0 0.5 1 1.5 –20 0 20 40 60 80 100
(a) (b)
FIGURE 4.21 (a) Section of the geometry of three adjacent sensor elements on one
100 μm substrate. Only a part of the substrate is shown. The lines indicate the
mesh. (b) Plot of the calculated temperature distribution.
0.05
0.012
0.04 4 1 2 3 PtOEP 0.010 4 1 2 3 PdOEP
PtOEP + mirror
Intensity (arb. units) 0.03 3 4 PtOEP + mirror + dopant Intensity (arb. units) 0.008 3 4 PdOEP + dopant + mirror
PdOEP + mirror
PtOEP + dopant
PdOEP + dopant
0.006
0.02
0.01 0.004
2 0.002
2
1
0.00 0.000 1
0 100 200 300 400 0 1 2 3 4
Time (μs) Time (ms)
(a) (b)
FIGURE 5.8 Effect of the titania dopant embedded in the PS fi lm and Al mirrors on
the PL decay of (a) PtOEP:PS and (b) PdOEP:PS fi lms in water in equilibrium with Ar
(~0 ppm DO). The fi lms were prepared by drop-casting 60 μL of toluene solution
containing 1 mg/mL TiO , 1 mg/mL dye, and 50 mg/mL PS.
2