Page 447 - Organic Electronics in Sensors and Biotechnology
P. 447

Current response               Voltage response
                   1 μm 2                                          1 μm 2
                   10 μm 2                                         10 μm 2
             10 –6  1000 μm 2                10 0                  1000 μm 2
                   1 mm 2                                          1 mm 2
             10 –8  1 cm 2                  10 –2                  1 cm 2
                                                                   10 cm 2
           Current (A)  10 –10  100 cm 2   Voltage (V)  10 –4      100 cm 2
                   10 cm 2
            10 –12
                                            10 –6
            10 –14                          10 –8
            10 –16                          10 –10
               10 –4  10 –2  10 0  10 2  10 4  10 6  10 –4  10 –2  10 0  10 2  10 4  10 6
                         Frequency (Hz)                 Frequency (Hz)
                            (a)                            (b)

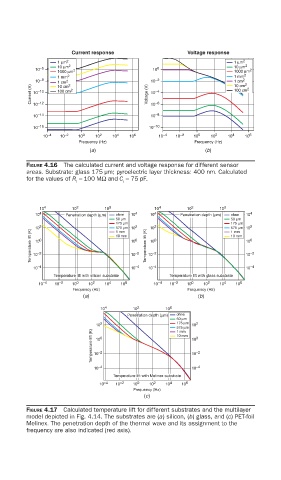
          FIGURE 4.16  The calculated current and voltage response for different sensor
          areas. Substrate: glass 175 μm; pyroelectric layer thickness: 400 nm. Calculated
          for the values of R =  100 MΩ and C = 75 pF.
                        i            i


              10 4     10 2     10 0         10 4     10 2     10 0
             10 4    Penetration depth (μm)  ohne  10 4  10 4  Penetration depth (μm)  ohne  10 4
                                   50 μm                          50 μm
                                   175 μm                         175 μm
             10 2                  575 μm  10 2  10 2             575 μm  10 2
           Temperature lift (K)  10 –2  10 0  Temperature lift (K)  10 –2  10 0
                                   1 mm
                                                                  1 mm
                                   10 mm
                                                                  10 mm
                                            10 0
             10 0
                                       10 –2
                                                                       10 –2
            10 –4                      10 –4  10 –4                    10 –4
                  Temperature lift with silicon substrate  Temperature lift with glass substrate
              10 –4  10 –2  10 0  10 2  10 4  10 6  10 –4  10 –2  10 0  10 2  10 4  10 6
                       Frequency (Hz)                 Frequency (Hz)
                          (a)                            (b)
                               10 4    10 2     10 0
                                      Penetration depth (μm)  ohne
                                                   50 μm
                             10 2                  175 μm  10 2
                                                   575 μm
                            Temperature lift (K)  10 –2  10 0
                                                   1 mm
                                                   10 mm
                             10 0
                                                        10 –2
                             10 –4                      10 –4
                                  Temperature lift with Melinex substrate
                              10 –4  10 –2  10 0  10 2  10 4  10 6
                                        Frequency (Hz)
                                           (c)
          FIGURE 4.17  Calculated temperature lift for different substrates and the multilayer
          model depicted in Fig. 4.14. The substrates are (a) silicon, (b) glass, and (c) PET-foil
          Melinex. The penetration depth of the thermal wave and its assignment to the
          frequency are also indicated (red axis).
   442   443   444   445   446   447   448   449   450   451   452