
Page 451 - Organic Electronics in Sensors and Biotechnology
P. 451
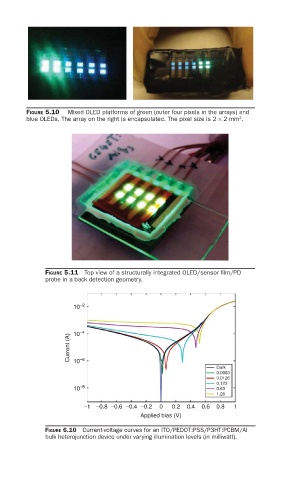
FIGURE 5.10   Mixed OLED platforms of green (outer four pixels in the arrays) and
                                                                     2
          blue OLEDs. The array on the right is encapsulated. The pixel size is 2 × 2 mm .


               FIGURE 5.11  Top view of a structurally integrated OLED/sensor fi lm/PD
               probe in a back detection geometry.


                       10 –2


                      Current (A)  10 –4


                         –6
                       10
                                                              Dark
                                                              0.0063
                                                              0.0126
                                                              0.123
                       10 –8                                  0.63
                                                              1.26
                          –1  –0.8  –0.6  –0.4  –0.2  0  0.2  0.4  0.6  0.8  1
                                          Applied bias (V)
               FIGURE 6.10  Current-voltage curves for an ITO/PEDOT:PSS/P3HT:PCBM/Al
               bulk heterojunction device under varying illumination levels (in milliwatt).