
Page 89 - Organic Electronics in Sensors and Biotechnology
P. 89
66 Cha pte r T w o
The solution emission spectrum is characterized by a maximum
568 nm localized in the green-yellow region accompanied by a shoul-
der at longer wavelength, ascribable to a poorly resolved vibronic
replica. The measured Stokes shift is equal to 64 nm. This value sug-
gests that appreciable nonradiative processes take place before the
absorbed photons are reemitted. The nonradiative processes can orig-
inate from either molecular rearrangements or solvent-molecule
interactions upon photoexcitation.
The optical properties of the D3ANT were also investigated in the
solid state (Fig. 2.3b). The absorption spectrum is characterized by a
marked red-shifted band at 535 nm accompanied by a new more
intense red-shifted band at 603 nm. The latter clearly indicates strong
electronic interaction between molecules in the films and is generally
recognized as the aggregation band. Actually for oligo and poly
arylene ethynylene systems, the situation is somewhat complicated
by the conformational freedom of the conjugated backbone; in fact the
red-shifted band might originate from the cooperative effect of both
molecular planarization of conjugated backbone and electronic orbital
interaction between different conjugated backbones. 121–124 The emis-
sion spectrum at the solid state is characterized by a consistent red
shift of the maxima (677 nm) with respect to those in solution, inde-
pendently of the exciting wavelength. We suppose that in the solid
state the emission arises only from the intermolecular aggregates.
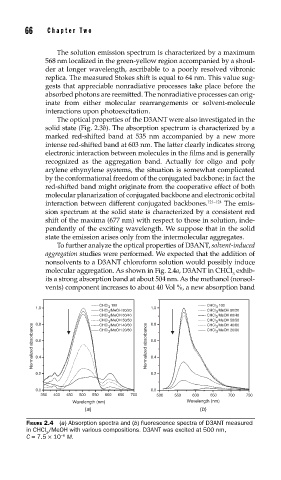
To further analyze the optical properties of D3ANT, solvent-induced
aggregation studies were performed. We expected that the addition of
nonsolvents to a D3ANT chloroform solution would possibly induce
molecular aggregation. As shown in Fig. 2.4a, D3ANT in CHCl exhib-
3
its a strong absorption band at about 504 nm. As the methanol (nonsol-
vents) component increases to about 40 Vol %, a new absorption band
CHCl 100 CHCl 100
1.0 3 1.0 3
CHCl /MeOH 80/20 CHCl /MeOH 80/20
3
3
CHCl /MeOH 60/40 CHCl /MeOH 60/40
3 3
CHCl /MeOH 50/50 0.8 CHCl /MeOH 50/50
3
3
Normalized absorbance 0.6 Normalized absorbance 0.6
0.8
CHCl /MeOH 40/60
CHCl /MeOH 40/60
3
3
CHCl /MeOH 20/80
CHCl /MeOH 20/80
3
3
0.4
0.4
0.2 0.2
0.0 0.0
350 400 450 500 550 600 650 700 500 550 600 650 700 750
Wavelength (nm) Wavelength (nm)
(a) (b)
FIGURE 2.4 (a) Absorption spectra and (b) fl uorescence spectra of D3ANT measured
in CHCl /MeOH with various compositions. D3ANT was excited at 500 nm,
3
C = 7.5 × 10 M.
−6