
Page 140 - Origin and Prediction of Abnormal Formation Pressures
P. 140
SMECTITE-ILLITE TRANSFORMATIONS l 17
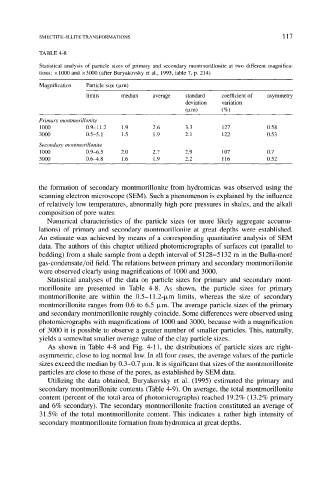
TABLE 4-8
Statistical analysis of particle sizes of primary and secondary montmorillonite at two different magnifica-
tions: x 1000 and x3000 (after Buryakovsky et al., 1995, table 7, p. 214)
Magnification Particle size (~m)
limits median average standard coefficient of asymmetry
deviation variation
(~m) (%)
Primary montmorillonite
1000 0.9-11.2 1.9 2.6 3.3 127 0.58
3000 0.5-5.1 1.5 1.9 2.1 122 0.53
Secondary montmorillonite
1000 0.9-6.5 2.0 2.7 2.9 107 0.7
3000 0.6-4.8 1.6 1.9 2.2 116 0.52
the formation of secondary montmorillonite from hydromicas was observed using the
scanning electron microscope (SEM). Such a phenomenon is explained by the influence
of relatively low temperatures, abnormally high pore pressures in shales, and the alkali
composition of pore water.
Numerical characteristics of the particle sizes (or more likely aggregate accumu-
lations) of primary and secondary montmorillonite at great depths were established.
An estimate was achieved by means of a corresponding quantitative analysis of SEM
data. The authors of this chapter utilized photomicrographs of surfaces cut (parallel to
bedding) from a shale sample from a depth interval of 5128-5132 m in the Bulla-mor6
gas-condensate/oil field. The relations between primary and secondary montmorillonite
were observed clearly using magnifications of 1000 and 3000.
Statistical analyses of the data on particle sizes for primary and secondary mont-
morillonite are presented in Table 4-8. As shown, the particle sizes for primary
montmorillonite are within the 0.5-11.2-~m limits, whereas the size of secondary
montmorillonite ranges from 0.6 to 6.5 [~m. The average particle sizes of the primary
and secondary montmorillonite roughly coincide. Some differences were observed using
photomicrographs with magnifications of 1000 and 3000, because with a magnification
of 3000 it is possible to observe a greater number of smaller particles. This, naturally,
yields a somewhat smaller average value of the clay particle sizes.
As shown in Table 4-8 and Fig. 4-11, the distributions of particle sizes are right-
asymmetric, close to log normal law. In all four cases, the average values of the particle
sizes exceed the median by 0.3-0.7 Ixm. It is significant that sizes of the montmorillonite
particles are close to those of the pores, as established by SEM data.
Utilizing the data obtained, Buryakovsky et al. (1995) estimated the primary and
secondary montmorillonite contents (Table 4-9). On average, the total montmorillonite
content (percent of the total area of photomicrographs) reached 19.2% (13.2% primary
and 6% secondary). The secondary montmorillonite fraction constituted an average of
31.5% of the total montmorillonite content. This indicates a rather high intensity of
secondary montmorillonite formation from hydromica at great depths.