
Page 141 - Origin and Prediction of Abnormal Formation Pressures
P. 141
] ] 8 L.A. BURYAKOVSKY, R.D. DJEVANSHIR, G.V. CHILINGAR, H.H. RIEKE III AND J.O. ROBERTSON, JR.
7
(a) (b)
~, 0.3 ~0.3
0
C 8
~ 0.2
o.2
Um
u_
(b
.-->
0.1 O.l -
0
0 i
i (I)
rv
rv o 0
1.8 2.5 3.1 3.6 4.0 4.4 4.8 1.8 2.5 3.1 3.6 4,0 4,4 4.8
Particle Size (d), l~m Particle Size (d), ~m
Z
$, o.3 (' ,, 0.3
8 (c) (d)
O.2 ~" 0.2
e
i..i.. u_
I
O.1 ~ 0.1 -
0 l- -tl r--i [--~ F l "" o [-I-I F-~l F--l ~
1.3 1.9 2.3 3.0 3.7 5.1 1.3 1.9 2.3 2.7 3.0 3.8
Particle Size (d), ~m Particle Size (d), ~m
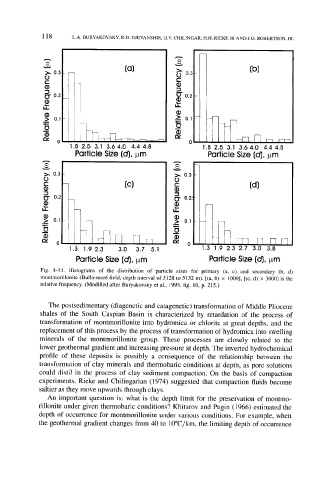
Fig. 4-11. Histograms of the distribution of particle sizes for primary (a, c) and secondary (b, d)
montmorillonite (Bulla-mor6 field; depth interval of 5128 to 5132 m). [(a, b) x 1000], [(c, d) x 3000] is the
relative frequency. (Modified after Buryakovsky et al., 1995, fig. 10, p. 215.)
The postsedimentary (diagenetic and catagenetic) transformation of Middle Pliocene
shales of the South Caspian Basin is characterized by retardation of the process of
transformation of montmorillonite into hydromica or chlorite at great depths, and the
replacement of this process by the process of transformation of hydromica into swelling
minerals of the montmorillonite group. These processes are closely related to the
lower geothermal gradient and increasing pressure at depth. The inverted hydrochemical
profile of these deposits is possibly a consequence of the relationship between the
transformation of clay minerals and thermobaric conditions at depth, as pore solutions
could distil in the process of clay sediment compaction. On the basis of compaction
experiments, Rieke and Chilingarian (1974) suggested that compaction fluids become
saltier as they move upwards through clays.
An important question is: what is the depth limit for the preservation of montmo-
rillonite under given thermobaric conditions? Khitarov and Pugin (1966) estimated the
depth of occurrence for montmorillonite under various conditions. For example, when
the geothermal gradient changes from 40 to 10~ the limiting depth of occurrence