
Page 306 - Origin and Prediction of Abnormal Formation Pressures
P. 306
276 H.H. RIEKE, G.V. CHILINGAR AND J.O. ROBERTSON JR.
A
~xxxxxxx'~xxx'
:::- q
r
_..L_
~xxx xxxxxx xx ~' ,' ,XX X L L "IX X XX~k X'XXXXXXXXXXXXXXXXXV
t
=
r
' ~ 1 | 1 1 ~
tm ~_ - - - - i ~ . ~ - - - ~ ~ " - __.i._.
.~XXXXXXXXXXN2 ~XXXXXXX,XXXXXXXXXXXXXXXXXXXXXXX'~
C
, . . . . . . . . . . . .
limit r = 0
. . . . . . . . . . . . . .
tZZZI||||||||||
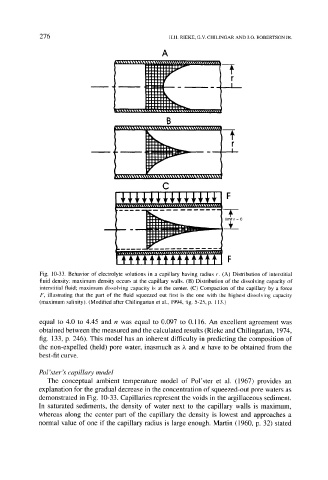
Fig. 10-33. Behavior of electrolyte solutions in a capillary having radius r. (A) Distribution of interstitial
fluid density; maximum density occurs at the capillary walls. (B) Distribution of the dissolving capacity of
interstitial fluid; maximum dissolving capacity is at the center. (C) Compaction of the capillary by a force
F, illustrating that the part of the fluid squeezed out first is the one with the highest dissolving capacity
(maximum salinity). (Modified after Chilingarian et al., 1994, fig. 5-25, p. 113.)
equal to 4.0 to 4.45 and n was equal to 0.097 to 0. l l 6. An excellent agreement was
obtained between the measured and the calculated results (Rieke and Chilingarian, 1974,
fig. 133, p. 246). This model has an inherent difficulty in predicting the composition of
the non-expelled (held) pore water, inasmuch as ~, and n have to be obtained from the
best-fit curve.
Pol'ster's capillary model
The conceptual ambient temperature model of Pol'ster et al. (1967) provides an
explanation for the gradual decrease in the concentration of squeezed-out pore waters as
demonstrated in Fig. 10-33. Capillaries represent the voids in the argillaceous sediment.
In saturated sediments, the density of water next to the capillary walls is maximum,
whereas along the center part of the capillary the density is lowest and approaches a
normal value of one if the capillary radius is large enough. Martin (1960, p. 32) stated