
Page 353 - Orlicky's Material Requirements Planning
P. 353
332 PART 3 Managing with the MRP System
often was used as the referee in disputes among sales, marketing, and manufacturing.
Multiple sets of numbers existed, and all improvements were functional and therefore
disconnected. For example, an inventory-reduction project to improve cash flow would
be initiated by finance and supported by manufacturing. Sales and marketing would
make no contribution until customer service suffered. The inventory-reduction project
then would be followed by a customer-first project led by sales, until inventory or the cost
of complexity again became the focal point.
The premise of traditional S&OP is that customer service and inventory are resultants.
To manage them effectively, we must manage the drivers, that is, demand and supply.
S&OP was a breakthrough in that it forced sales, marketing, and manufacturing to
agree once a month to one set of numbers for sales, production, and inventory. Within the
month, there would be a sales planning meeting, chaired by the sales director, agreeing
on the volumes at family level predicted for sale for the next 12 to 18 months, called
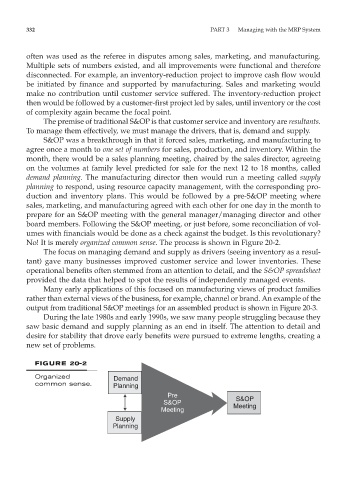
demand planning. The manufacturing director then would run a meeting called supply
planning to respond, using resource capacity management, with the corresponding pro-
duction and inventory plans. This would be followed by a pre-S&OP meeting where
sales, marketing, and manufacturing agreed with each other for one day in the month to
prepare for an S&OP meeting with the general manager/managing director and other
board members. Following the S&OP meeting, or just before, some reconciliation of vol-
umes with financials would be done as a check against the budget. Is this revolutionary?
No! It is merely organized common sense. The process is shown in Figure 20-2.
The focus on managing demand and supply as drivers (seeing inventory as a resul-
tant) gave many businesses improved customer service and lower inventories. These
operational benefits often stemmed from an attention to detail, and the S&OP spreadsheet
provided the data that helped to spot the results of independently managed events.
Many early applications of this focused on manufacturing views of product families
rather than external views of the business, for example, channel or brand. An example of the
output from traditional S&OP meetings for an assembled product is shown in Figure 20-3.
During the late 1980s and early 1990s, we saw many people struggling because they
saw basic demand and supply planning as an end in itself. The attention to detail and
desire for stability that drove early benefits were pursued to extreme lengths, creating a
new set of problems.
FIGURE 20-2
Organized Demand
common sense. Planning
Pre
S&OP S&OP
Meeting Meeting
Supply
Planning