
Page 354 - Orlicky's Material Requirements Planning
P. 354
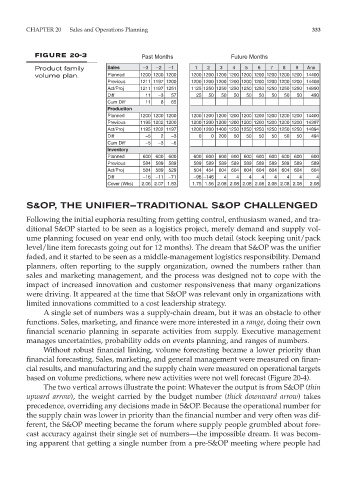
CHAPTER 20      Sales and Operations Planning                                   333


           FIGURE 20-3                   Past Months             Future Months

           Product family      Sales     –3  –2  –1    1   2  3   4  5   6  7   8  9   Ann
           volume plan.        Planned   1200  1200  1200   1200 1200  1200 1200 1200 1200  1200 1200 1200  14400
                               Previous   1211  1197  1200   1200 1200  1200 1200 1200 1200  1200 1200 1200  14408
                               Act/Proj   1211  1197  1251   1125 1250  1250 1250 1250 1250  1250 1250 1250  14890
                               Diff       11  –3  57    25  50  50  50  50  50  50  50  50  490
                               Cum Diff   11   8   65
                               Production
                               Planned   1200  1200  1200   1200 1200  1200 1200 1200 1200  1200 1200 1200  14400
                               Previous   1195  1202  1200   1200 1200  1200 1200 1200 1200  1200 1200 1200  14397
                               Act/Proj   1195  1202  1197   1200 1200  1400 1250 1250 1250  1250 1250 1250  14894
                               Diff       –5  2  –3     0   0  200  50  50  50  50  50  50  494
                               Cum Diff   –5   –3   –6
                               Inventory
                               Planned   600  600  600   600  600  600 600 600 600  600 600 600   600
                               Previous   584  589  589   589  589  589 589 589 589  589 589 589   589
                               Act/Proj   584  589  529   504  454  604 604 604 604  604 604 604   604
                               Diff      –16  –11  –71  –96 –146  4  4  4  4  4  4  4    4
                               Cover (Wks)   2.06 2.07  1.83   1.75  1.56 2.08  2.08  2.08  2.08 2.08  2.08  2.08   2.08

        S&OP, THE UNIFIER—TRADITIONAL S&OP CHALLENGED

        Following the initial euphoria resulting from getting control, enthusiasm waned, and tra-
        ditional S&OP started to be seen as a logistics project, merely demand and supply vol-
        ume planning focused on year end only, with too much detail (stock keeping unit/pack
        level/line item forecasts going out for 12 months). The dream that S&OP was the unifier
        faded, and it started to be seen as a middle-management logistics responsibility. Demand
        planners, often reporting to the supply organization, owned the numbers rather than
        sales and marketing management, and the process was designed not to cope with the
        impact of increased innovation and customer responsiveness that many organizations
        were driving. It appeared at the time that S&OP was relevant only in organizations with
        limited innovations committed to a cost leadership strategy.
             A single set of numbers was a supply-chain dream, but it was an obstacle to other
        functions. Sales, marketing, and finance were more interested in a range, doing their own
        financial scenario planning in separate activities from supply. Executive management
        manages uncertainties, probability odds on events planning, and ranges of numbers.
             Without robust financial linking, volume forecasting became a lower priority than
        financial forecasting. Sales, marketing, and general management were measured on finan-
        cial results, and manufacturing and the supply chain were measured on operational targets
        based on volume predictions, where new activities were not well forecast (Figure 20-4).
             The two vertical arrows illustrate the point: Whatever the output is from S&OP (thin
        upward arrow), the weight carried by the budget number (thick downward arrow) takes
        precedence, overriding any decisions made in S&OP. Because the operational number for
        the supply chain was lower in priority than the financial number and very often was dif-
        ferent, the S&OP meeting became the forum where supply people grumbled about fore-
        cast accuracy against their single set of numbers—the impossible dream. It was becom-
        ing apparent that getting a single number from a pre-S&OP meeting where people had