
Page 52 - Orlicky's Material Requirements Planning
P. 52
CHAPTER 3 The Four Critical Questions Answered 33
7
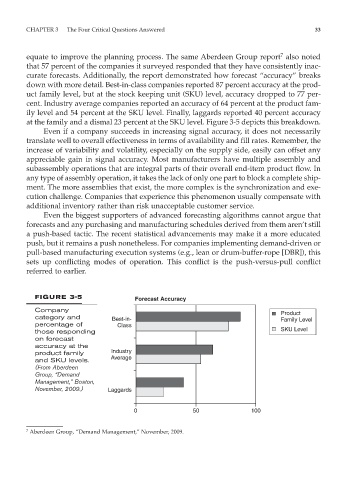
equate to improve the planning process. The same Aberdeen Group report also noted
that 57 percent of the companies it surveyed responded that they have consistently inac-
curate forecasts. Additionally, the report demonstrated how forecast “accuracy” breaks
down with more detail. Best-in-class companies reported 87 percent accuracy at the prod-
uct family level, but at the stock keeping unit (SKU) level, accuracy dropped to 77 per-
cent. Industry average companies reported an accuracy of 64 percent at the product fam-
ily level and 54 percent at the SKU level. Finally, laggards reported 40 percent accuracy
at the family and a dismal 23 percent at the SKU level. Figure 3-5 depicts this breakdown.
Even if a company succeeds in increasing signal accuracy, it does not necessarily
translate well to overall effectiveness in terms of availability and fill rates. Remember, the
increase of variability and volatility, especially on the supply side, easily can offset any
appreciable gain in signal accuracy. Most manufacturers have multiple assembly and
subassembly operations that are integral parts of their overall end-item product flow. In
any type of assembly operation, it takes the lack of only one part to block a complete ship-
ment. The more assemblies that exist, the more complex is the synchronization and exe-
cution challenge. Companies that experience this phenomenon usually compensate with
additional inventory rather than risk unacceptable customer service.
Even the biggest supporters of advanced forecasting algorithms cannot argue that
forecasts and any purchasing and manufacturing schedules derived from them aren’t still
a push-based tactic. The recent statistical advancements may make it a more educated
push, but it remains a push nonetheless. For companies implementing demand-driven or
pull-based manufacturing execution systems (e.g., lean or drum-buffer-rope [DBR]), this
sets up conflicting modes of operation. This conflict is the push-versus-pull conflict
referred to earlier.
FIGURE 3-5 Forecast Accuracy
Company
Product
category and Best-in- Family Level
percentage of Class
those responding SKU Level
on forecast
accuracy at the
product family Industry
and SKU levels. Average
(From Aberdeen
Group, “Demand
Management,” Boston,
November, 2009.) Laggards
0 50 100
7 Aberdeen Group, “Demand Management,” November, 2009.