
Page 51 - Orlicky's Material Requirements Planning
P. 51
32 PART 1 Perspective
In a survey of 135 companies,
■ 63 percent of the best-in-class (top 18 percent) companies reported that
they used spreadsheets for their demand management.
■ 71 percent of the industry average (middle 54 percent) performers reported
the use of spreadsheets for demand management.
■ 84 percent of laggard companies (bottom 28 percent) used spreadsheets.
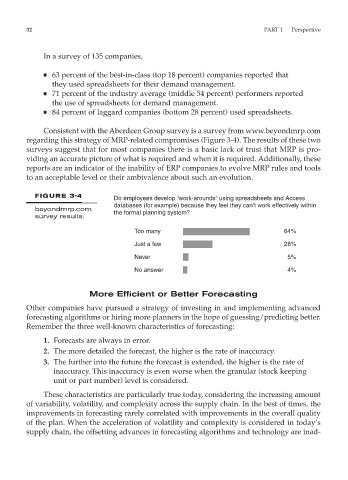
Consistent with the Aberdeen Group survey is a survey from www.beyondmrp.com
regarding this strategy of MRP-related compromises (Figure 3-4). The results of these two
surveys suggest that for most companies there is a basic lack of trust that MRP is pro-
viding an accurate picture of what is required and when it is required. Additionally, these
reports are an indicator of the inability of ERP companies to evolve MRP rules and tools
to an acceptable level or their ambivalence about such an evolution.
FIGURE 3-4 Do employees develop “work-arounds” using spreadsheets and Access
databases (for example) because they feel they can’t work effectively within
beyondmrp.com the formal planning system?
survey results.
Too many 64%
Just a few 28%
Never 5%
No answer 4%
More Efficient or Better Forecasting
Other companies have pursued a strategy of investing in and implementing advanced
forecasting algorithms or hiring more planners in the hope of guessing/predicting better.
Remember the three well-known characteristics of forecasting:
1. Forecasts are always in error.
2. The more detailed the forecast, the higher is the rate of inaccuracy.
3. The further into the future the forecast is extended, the higher is the rate of
inaccuracy. This inaccuracy is even worse when the granular (stock keeping
unit or part number) level is considered.
These characteristics are particularly true today, considering the increasing amount
of variability, volatility, and complexity across the supply chain. In the best of times, the
improvements in forecasting rarely correlated with improvements in the overall quality
of the plan. When the acceleration of volatility and complexity is considered in today’s
supply chain, the offsetting advances in forecasting algorithms and technology are inad-