
Page 50 - Orlicky's Material Requirements Planning
P. 50
CHAPTER 3 The Four Critical Questions Answered 31
ways to sidestep these shortcomings. The typical compromises used to work around
these shortcomings include
■ Manual work-around proliferation
■ Attempts at more efficient forecasting
■ Manual reorder point systems
■ Overflattening the bill of materials
■ Move to a make-to-order (MTO) model
■ “Dumbing down” MRP
Manual Work-Around Proliferation
Frequently, companies try to work around the shortcomings of their MRP system by relying
on stand-alone, disconnected, and highly customized data manipulation tools such as Excel
spreadsheets and Access minisystems. Data are taken from a core MRP tool and then manip-
ulated by an individual. Typically, this individual is the one who actually built the sheet or
minisystem and, consequently, usually is the only one who knows how to use it. From a risk-
mitigation standpoint, this is unacceptable. The company’s ability to plan and execute
against those plans can be crippled by the loss of this individual. These tools have serious
limitations, and their proliferation makes the information technology (IT) landscape more
complicated and maintenance more intensive. Their widespread use ultimately defeats the
purpose behind the major investment in an integrated ERP package because the information
garnered is limited to the individual user. Many have called this “Excel hell.”
6
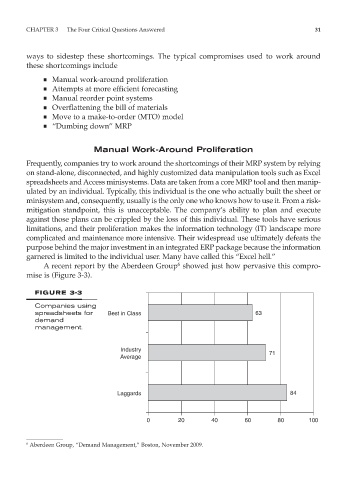
A recent report by the Aberdeen Group showed just how pervasive this compro-
mise is (Figure 3-3).
FIGURE 3-3
Companies using
spreadsheets for Best in Class 63
demand
management.
Industry 71
Average
Laggards 84
0 20 40 60 80 100
6 Aberdeen Group, “Demand Management,” Boston, November 2009.