
Page 271 - PVT Property Correlations
P. 271
Artificial Neural Network Models for PVT Properties Chapter | 10 237
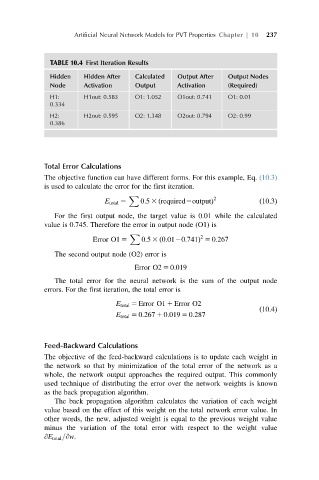
TABLE 10.4 First Iteration Results
Hidden Hidden After Calculated Output After Output Nodes
Node Activation Output Activation (Required)
H1: H1out: 0.583 O1: 1.052 O1out: 0.741 O1: 0.01
0.334
H2: H2out: 0.595 O2: 1.348 O2out: 0.794 O2: 0.99
0.386
Total Error Calculations
The objective function can have different forms. For this example, Eq. (10.3)
is used to calculate the error for the first iteration.
X 2
E total 5 0:5 3 required2outputÞ ð10:3Þ
ð
For the first output node, the target value is 0.01 while the calculated
value is 0.745. Therefore the error in output node (O1) is
X 2
Error O1 5 0:5 3 0:0120:741Þ 5 0:267
ð
The second output node (O2) error is
Error O2 5 0:019
The total error for the neural network is the sum of the output node
errors. For the first iteration, the total error is
E total 5 Error O1 1 Error O2
ð10:4Þ
E total 5 0:267 1 0:019 5 0:287
Feed-Backward Calculations
The objective of the feed-backward calculations is to update each weight in
the network so that by minimization of the total error of the network as a
whole, the network output approaches the required output. This commonly
used technique of distributing the error over the network weights is known
as the back propagation algorithm.
The back propagation algorithm calculates the variation of each weight
value based on the effect of this weight on the total network error value. In
other words, the new, adjusted weight is equal to the previous weight value
minus the variation of the total error with respect to the weight value
@E total =@w.