
Page 273 - PVT Property Correlations
P. 273
Artificial Neural Network Models for PVT Properties Chapter | 10 239
variation (optionally multiplied by a learning rate). The learning rate for this
example is assumed 0.6.
W new 5 W5 2 learn rate 3 @E total ð10:12Þ
5
@W5
W new 5 0:4 2 0:6 3 0:082 5 0:351
5
The process is continued in the same way to calculate the other weights
for the same layer (i.e., W6, W7, and W8).
The same process of weight adjustment is repeated for the preceding
layer (i.e., W1, W2, W3, and W4) by use of the same total error value and
the values of the hidden layer nodes (i.e., H1out and H2out). Notice that the
adjustments of weights between the hidden layer nodes and input layer nodes
are affected by all output nodes errors. Therefore, the first term of Eq. (10.5)
is calculated using Eq. (10.13) to consider the effect of all output nodes on
these weights.
@E total @E total @E total
5 1 ð10:13Þ
@O @O1 @O2
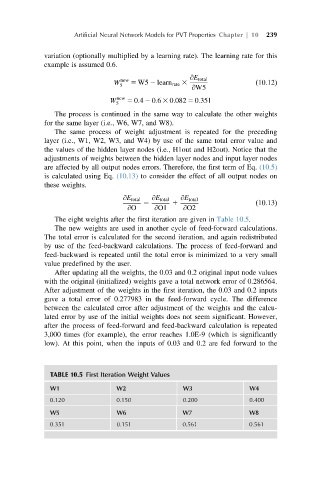
The eight weights after the first iteration are given in Table 10.5.
The new weights are used in another cycle of feed-forward calculations.
The total error is calculated for the second iteration, and again redistributed
by use of the feed-backward calculations. The process of feed-forward and
feed-backward is repeated until the total error is minimized to a very small
value predefined by the user.
After updating all the weights, the 0.03 and 0.2 original input node values
with the original (initialized) weights gave a total network error of 0.286564.
After adjustment of the weights in the first iteration, the 0.03 and 0.2 inputs
gave a total error of 0.277983 in the feed-forward cycle. The difference
between the calculated error after adjustment of the weights and the calcu-
lated error by use of the initial weights does not seem significant. However,
after the process of feed-forward and feed-backward calculation is repeated
3,000 times (for example), the error reaches 1.0E-9 (which is significantly
low). At this point, when the inputs of 0.03 and 0.2 are fed forward to the
TABLE 10.5 First Iteration Weight Values
W1 W2 W3 W4
0.120 0.150 0.200 0.400
W5 W6 W7 W8
0.351 0.151 0.561 0.561