
Page 274 - PVT Property Correlations
P. 274
240 PVT Property Correlations
TABLE 10.6 Final Weight Values
W1 W2 W3 W4
0.974 0.259 0.053 2 0.197
W5 W6 W7 W8
2 3.868 2 5.295 5.933 0.655
0.35
0.30
0.25
Network total error 0.20
0.15
0.10
0.05
0.00
0 20 40 60 80
Iteration
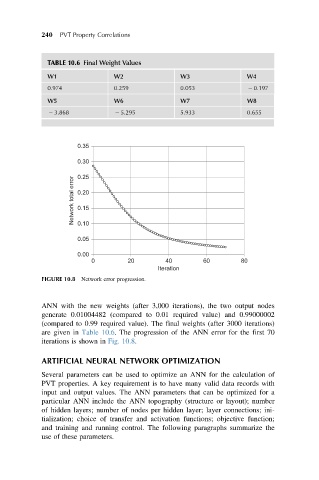
FIGURE 10.8 Network error progression.
ANN with the new weights (after 3,000 iterations), the two output nodes
generate 0.01004482 (compared to 0.01 required value) and 0.99000002
(compared to 0.99 required value). The final weights (after 3000 iterations)
are given in Table 10.6. The progression of the ANN error for the first 70
iterations is shown in Fig. 10.8.
ARTIFICIAL NEURAL NETWORK OPTIMIZATION
Several parameters can be used to optimize an ANN for the calculation of
PVT properties. A key requirement is to have many valid data records with
input and output values. The ANN parameters that can be optimized for a
particular ANN include the ANN topography (structure or layout); number
of hidden layers; number of nodes per hidden layer; layer connections; ini-
tialization; choice of transfer and activation functions; objective function;
and training and running control. The following paragraphs summarize the
use of these parameters.