
Page 56 - PVT Property Correlations
P. 56
36 PVT Property Correlations
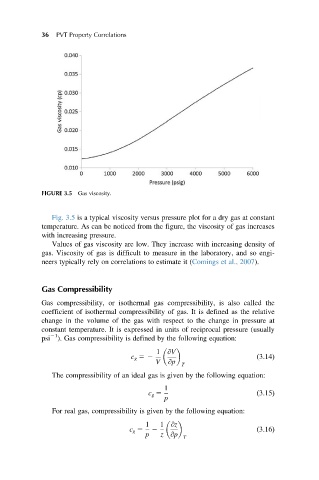
FIGURE 3.5 Gas viscosity.
Fig. 3.5 is a typical viscosity versus pressure plot for a dry gas at constant
temperature. As can be noticed from the figure, the viscosity of gas increases
with increasing pressure.
Values of gas viscosity are low. They increase with increasing density of
gas. Viscosity of gas is difficult to measure in the laboratory, and so engi-
neers typically rely on correlations to estimate it (Comings et al., 2007).
Gas Compressibility
Gas compressibility, or isothermal gas compressibility, is also called the
coefficient of isothermal compressibility of gas. It is defined as the relative
change in the volume of the gas with respect to the change in pressure at
constant temperature. It is expressed in units of reciprocal pressure (usually
21
psi ). Gas compressibility is defined by the following equation:
1 @V
c g 52 ð3:14Þ
V @p
T
The compressibility of an ideal gas is given by the following equation:
1
c g 5 ð3:15Þ
p
For real gas, compressibility is given by the following equation:
1 1 @z
c g 5 2 ð3:16Þ
p z @p T