
Page 163 - Partition & Adsorption of Organic Contaminants in Environmental Systems
P. 163
154 CONTAMINANT SORPTION TO SOILS AND NATURAL SOLIDS
3
Uptake by Soil, Q (mg/g) 2
1
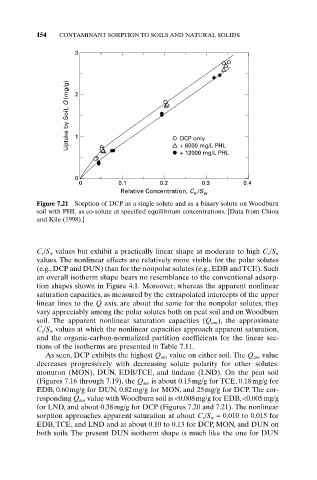
DCP only
+ 6000 mg/L PHL
+ 12000 mg/L PHL
0
0 0.1 0.2 0.3 0.4
Relative Concentration, C /S w
e
Figure 7.21 Sorption of DCP as a single solute and as a binary solute on Woodburn
soil with PHL as co-solute at specified equilibrium concentrations. [Data from Chiou
and Kile (1998).]
C e/S w values but exhibit a practically linear shape at moderate to high C e/S w
values. The nonlinear effects are relatively more visible for the polar solutes
(e.g., DCP and DUN) than for the nonpolar solutes (e.g., EDB and TCE). Such
an overall isotherm shape bears no resemblance to the conventional adsorp-
tion shapes shown in Figure 4.1. Moreover, whereas the apparent nonlinear
saturation capacities, as measured by the extrapolated intercepts of the upper
linear lines to the Q axis, are about the same for the nonpolar solutes, they
vary appreciably among the polar solutes both on peat soil and on Woodburn
soil. The apparent nonlinear saturation capacities (Q ans ), the approximate
C e /S w values at which the nonlinear capacities approach apparent saturation,
and the organic-carbon-normalized partition coefficients for the linear sec-
tions of the isotherms are presented in Table 7.11.
As seen, DCP exhibits the highest Q ans value on either soil. The Q ans value
decreases progressively with decreasing solute polarity for other solutes:
monuron (MON), DUN, EDB/TCE, and lindane (LND). On the peat soil
(Figures 7.16 through 7.19), the Q ans is about 0.15mg/g for TCE, 0.18mg/g for
EDB, 0.60mg/g for DUN, 0.82mg/g for MON, and 25mg/g for DCP. The cor-
responding Q ans value with Woodburn soil is <0.008mg/g for EDB, <0.005mg/g
for LND, and about 0.38mg/g for DCP (Figures 7.20 and 7.21). The nonlinear
sorption approaches apparent saturation at about C e/S w = 0.010 to 0.015 for
EDB, TCE, and LND and at about 0.10 to 0.13 for DCP, MON, and DUN on
both soils. The present DUN isotherm shape is much like the one for DUN