
Page 160 - Partition & Adsorption of Organic Contaminants in Environmental Systems
P. 160
SORPTION FROM WATER SOLUTION 151
sorption data were obtained on the peat soil ( f oc = 0.493), with supplemental
data on a mineral (Woodburn) soil (f oc = 0.0126). Polar solutes from two chem-
ical classes (phenols and substituted ureas) and three low-polarity solutes (eth-
ylene dibromide, TCE, and lindane) were employed in sorption experiments.
In addition to single-solute isotherms, the isotherms of nominal solutes in
many binary-solute mixtures were also determined, with the competing solutes
(co-solutes) taken from either the same class or from a different class. Binary-
solute sorption studies examine the competitive sorption of polar solutes both
between and within chemical classes, considering that the earlier binary-solute
studies were confined mainly to solutes from the same or similar class (Xing
et al., 1996). Results on solute competition are critical to assessing the effect
of various co-solutes on the behavior of a given solute (contaminant) in mul-
tisolute natural systems. A comparison of single-solute and binary-solute
isotherms enables one to separate the relative effects of linear partition to
SOM and nonlinear sorption to soil.
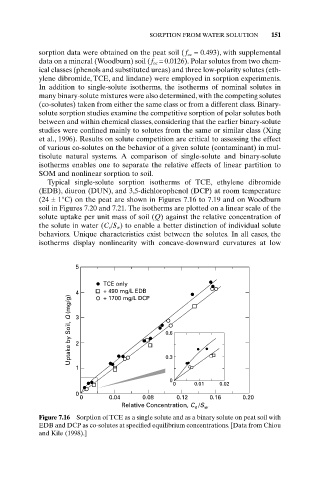
Typical single-solute sorption isotherms of TCE, ethylene dibromide
(EDB), diuron (DUN), and 3,5-dichlorophenol (DCP) at room temperature
(24 ± 1°C) on the peat are shown in Figures 7.16 to 7.19 and on Woodburn
soil in Figures 7.20 and 7.21. The isotherms are plotted on a linear scale of the
solute uptake per unit mass of soil (Q) against the relative concentration of
the solute in water (C e /S w ) to enable a better distinction of individual solute
behaviors. Unique characteristics exist between the solutes. In all cases, the
isotherms display nonlinearity with concave-downward curvatures at low
5
TCE only
+ 490 mg/L EDB
Uptake by Soil, Q (mg/g) 4 0.6
+ 1700 mg/L DCP
3
2
1 0.3
0
0 0.01 0.02
0
0 0.04 0.08 0.12 0.16 0.20
Relative Concentration, C /S w
e
Figure 7.16 Sorption of TCE as a single solute and as a binary solute on peat soil with
EDB and DCP as co-solutes at specified equilibrium concentrations. [Data from Chiou
and Kile (1998).]