
Page 196 - Performance Leadership
P. 196
Chapter 10 The Social Role of Organizations • 185
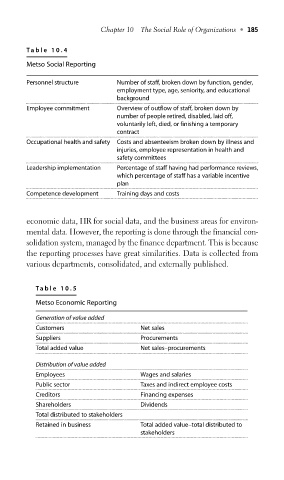
Table 10.4
Metso Social Reporting
Personnel structure Number of staff, broken down by function, gender,
employment type, age, seniority, and educational
background
Employee commitment Overview of outflow of staff, broken down by
number of people retired, disabled, laid off,
voluntarily left, died, or finishing a temporary
contract
Occupational health and safety Costs and absenteeism broken down by illness and
injuries, employee representation in health and
safety committees
Leadership implementation Percentage of staff having had performance reviews,
which percentage of staff has a variable incentive
plan
Competence development Training days and costs
economic data, HR for social data, and the business areas for environ-
mental data. However, the reporting is done through the financial con-
solidation system, managed by the finance department. This is because
the reporting processes have great similarities. Data is collected from
various departments, consolidated, and externally published.
Table 10.5
Metso Economic Reporting
Generation of value added
Customers Net sales
Suppliers Procurements
Total added value Net sales–procurements
Distribution of value added
Employees Wages and salaries
Public sector Taxes and indirect employee costs
Creditors Financing expenses
Shareholders Dividends
Total distributed to stakeholders
Retained in business Total added value–total distributed to
stakeholders